


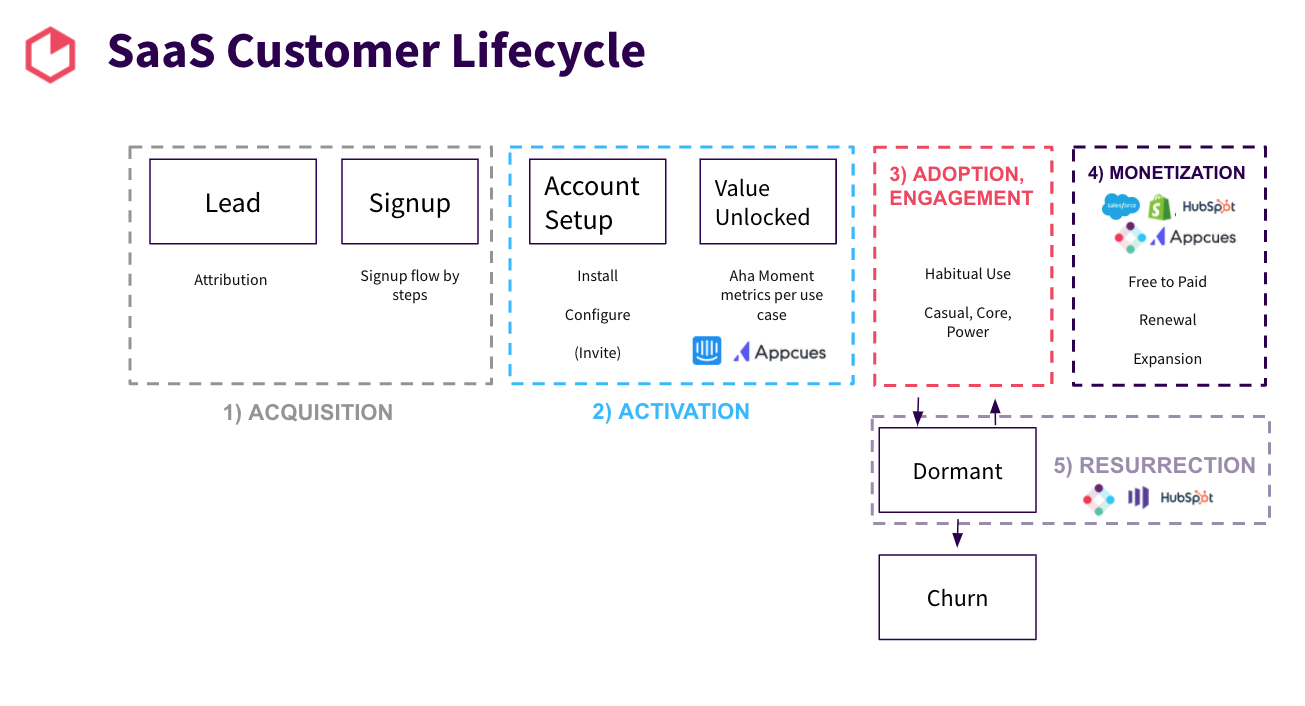
Activation
- In PLG motions, Activation and Onboarding means pretty much the same thing. It’s a set of self-serve flows designed to help prospects and new users of paying accounts set up their account, and guide them through experiencing your product’s value for the first time (the “Aha” moment). Many teams include habit creation in the Activation effort. Some refer to it as a complementary metric called Product Adoption Rate that monitors “stickiness”. Either way, you want to ensure that you are optimizing for all these three components (see chart).
In sales-assisted or sales-led motions - Activation usually refers to the first milestone in the user-onboarding process. This is the moment focuses on helping a user successfully progress from sign-up to setup to the Aha moment. Establishing habitual use may often require more effort from the Customer Success organization, collaborating with Customer Lifecycle Marketing teams.
Why is Activation important?
Activation touches 100% of your users, and is therefore the area with the highest potential for optimization. It has a strong influence on users' first impressions, and is one of the most important inputs of Retention - the key metric a subscription business is built on.
Metrics:
Setup rate - users who completed the setup steps needed to get to value/total
sign ups during, per time period.
Aha moment - the first time the user experiences the core value proposition of your product. To calculate your baseline and monitor your progress use the formula - Total users who experienced Aha/total users who completed setup.
Product adoption rate - monitors the creation of habitual user for newly activated users (in both free and paid accounts). Amount of users who established habitual use criteria (for example, weekly use of over 4 consecutive weeks)/ Amount of users who reached Aha.
Acquisition
- discover the most cost-effective ways to acquire new customers, and optimize these efforts to drive growth. To track acquisition, practitioners often measure conversion across two main funnels: first from lead to signup/free trial, and then from free to paid. In this document, it’s included under the Monetization growth lever, grouped together with the rest of the financial conversion events.
Engagement
- While Retention is a binary metric (an account is either retained or not) engagement captures a spectrum and as the above chart illustrates, is one of the primary input metrics to retention.
Monetization
The ultimate goal of acquiring, activating, and retaining customers is to earn revenue from them. Ideally, you want to earn more revenue from each customer over time, which is referred to as increasing lifetime value (LTV). This growth lever focuses on the mission of earning more money from the base of customers we have (paying or not paying). Input metrics for this lever are: conversion to paid, renewal, upsell/cross-sell (expansion), and
resurrection. In self-serve motions where there is a free tier offering, product adoption (habitual use) is critical for monetizing free accounts - so this lever is important to improve both before and after the purchase.
North Star Metric is used as a leading indicator for Revenue growth, and may change over time per the company’s and team’s focus. The North Star Metric (often broken into several smaller metrics and one big one) describes how well you are driving the user behavior that will align with your target outcome.
Retention
- Retention is the deciding factor in achieving strong profitability for any kind of subscription-based company. It is not a standalone metric, but rather an output of your activation, adoption, ongoing product engagement and resurrection performance.
Resurrection
- is a way to drive growth by identifying opportunities within a group of users that is no longer active/engaged, that would be more inclined to return, per a specific offering/the right time. Resurrection metrics can refer to product engagement as well as new successful monetization efforts - following the users’ re-engagement.
***
Cohort analysis: compares similar groups over time. As you iterate your way to growth, the experience of your users on your site or inside your product changes over time. This type of analysis can help you keep track of important trends of conversion or retention or other key metrics and learn if they’re going up or down over time.
Examples of useful cohort analyses that help you understand if you’re trending up or down:
- Average revenue per cohort over a period of time
- Compare conversion rates by the month a customer signed up
- Cohort analysis of monthly revenue over time
This way, you can surface clear patterns while also accounting for the customer’s lifecycle over time, as your product, market and users evolve.
***
Here are some of the resources I used while writing this article, where you can learn more about how to practice lean analytics to drive business growth:
Heap Groups
Heap Partners
Books:
Hacking Growth by Sean Ellis and Morgan Brown
Product-Led Onboarding by Ramli John
Product-Leg growth by Wes Bush
Concepts discussed in the Reforge Growth Series
Lean Analytics by Alistair Croll and Benjamin Joskovitz