Solved

comparing data in a report

  • 29 May 2022
  • 1 reply
  • 35 views

Hey, wondering if anyone else can help. 

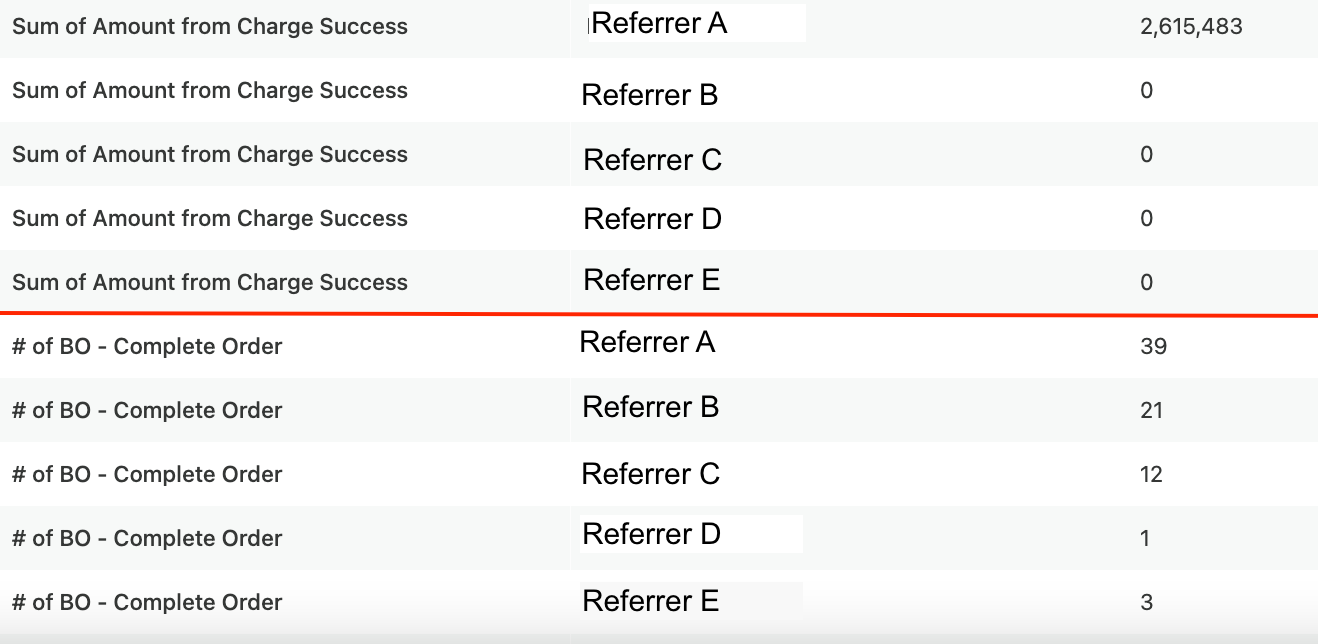
I’m trying to compare a table 2 different events, both grouped by the same measure which is ‘initial referrer’. Does anyone know how i can get 2 events into the table as separate columns rather than giving me 2 rows, 1 for each data point?

It lets you see it as a ratio, but i need the raw data. Any gurus out there? 🤔


icon

Best answer by jonathan 31 May 2022, 19:20

View original

1 reply

Userlevel 5
Badge +3

Hey @LukeGalli — good question. You’re looking for a pivot table visualization which we don’t currently support. I’ll file this as a product request for you.

In the meantime, I recommend exporting this report to CSV and handling the pivot in Excel or other spreadsheeting tool of choice.

Reply