Solved

Custom event properties not available in filters

  • 30 May 2023
  • 2 replies
  • 74 views

Userlevel 1
Badge +1

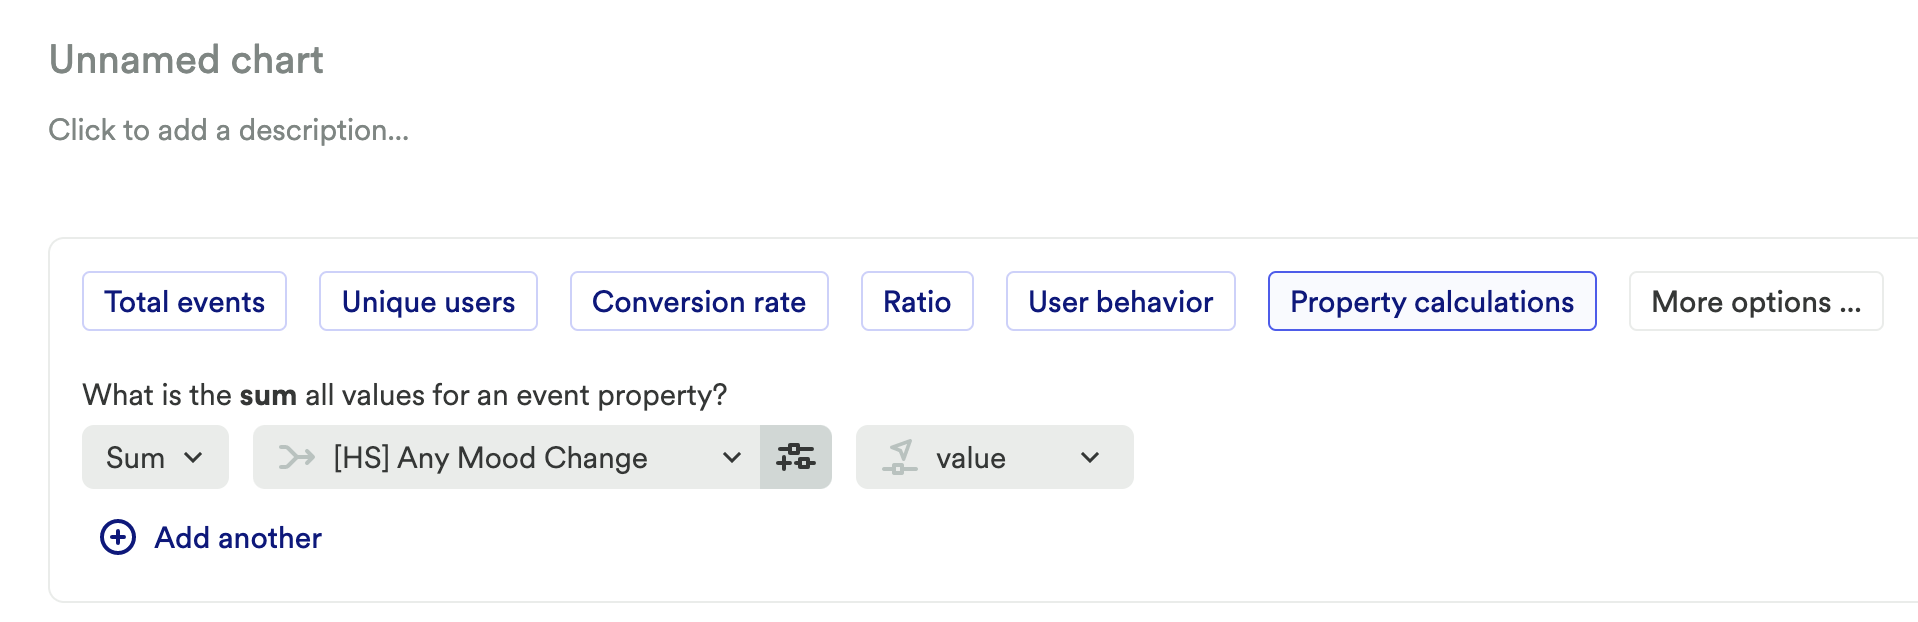
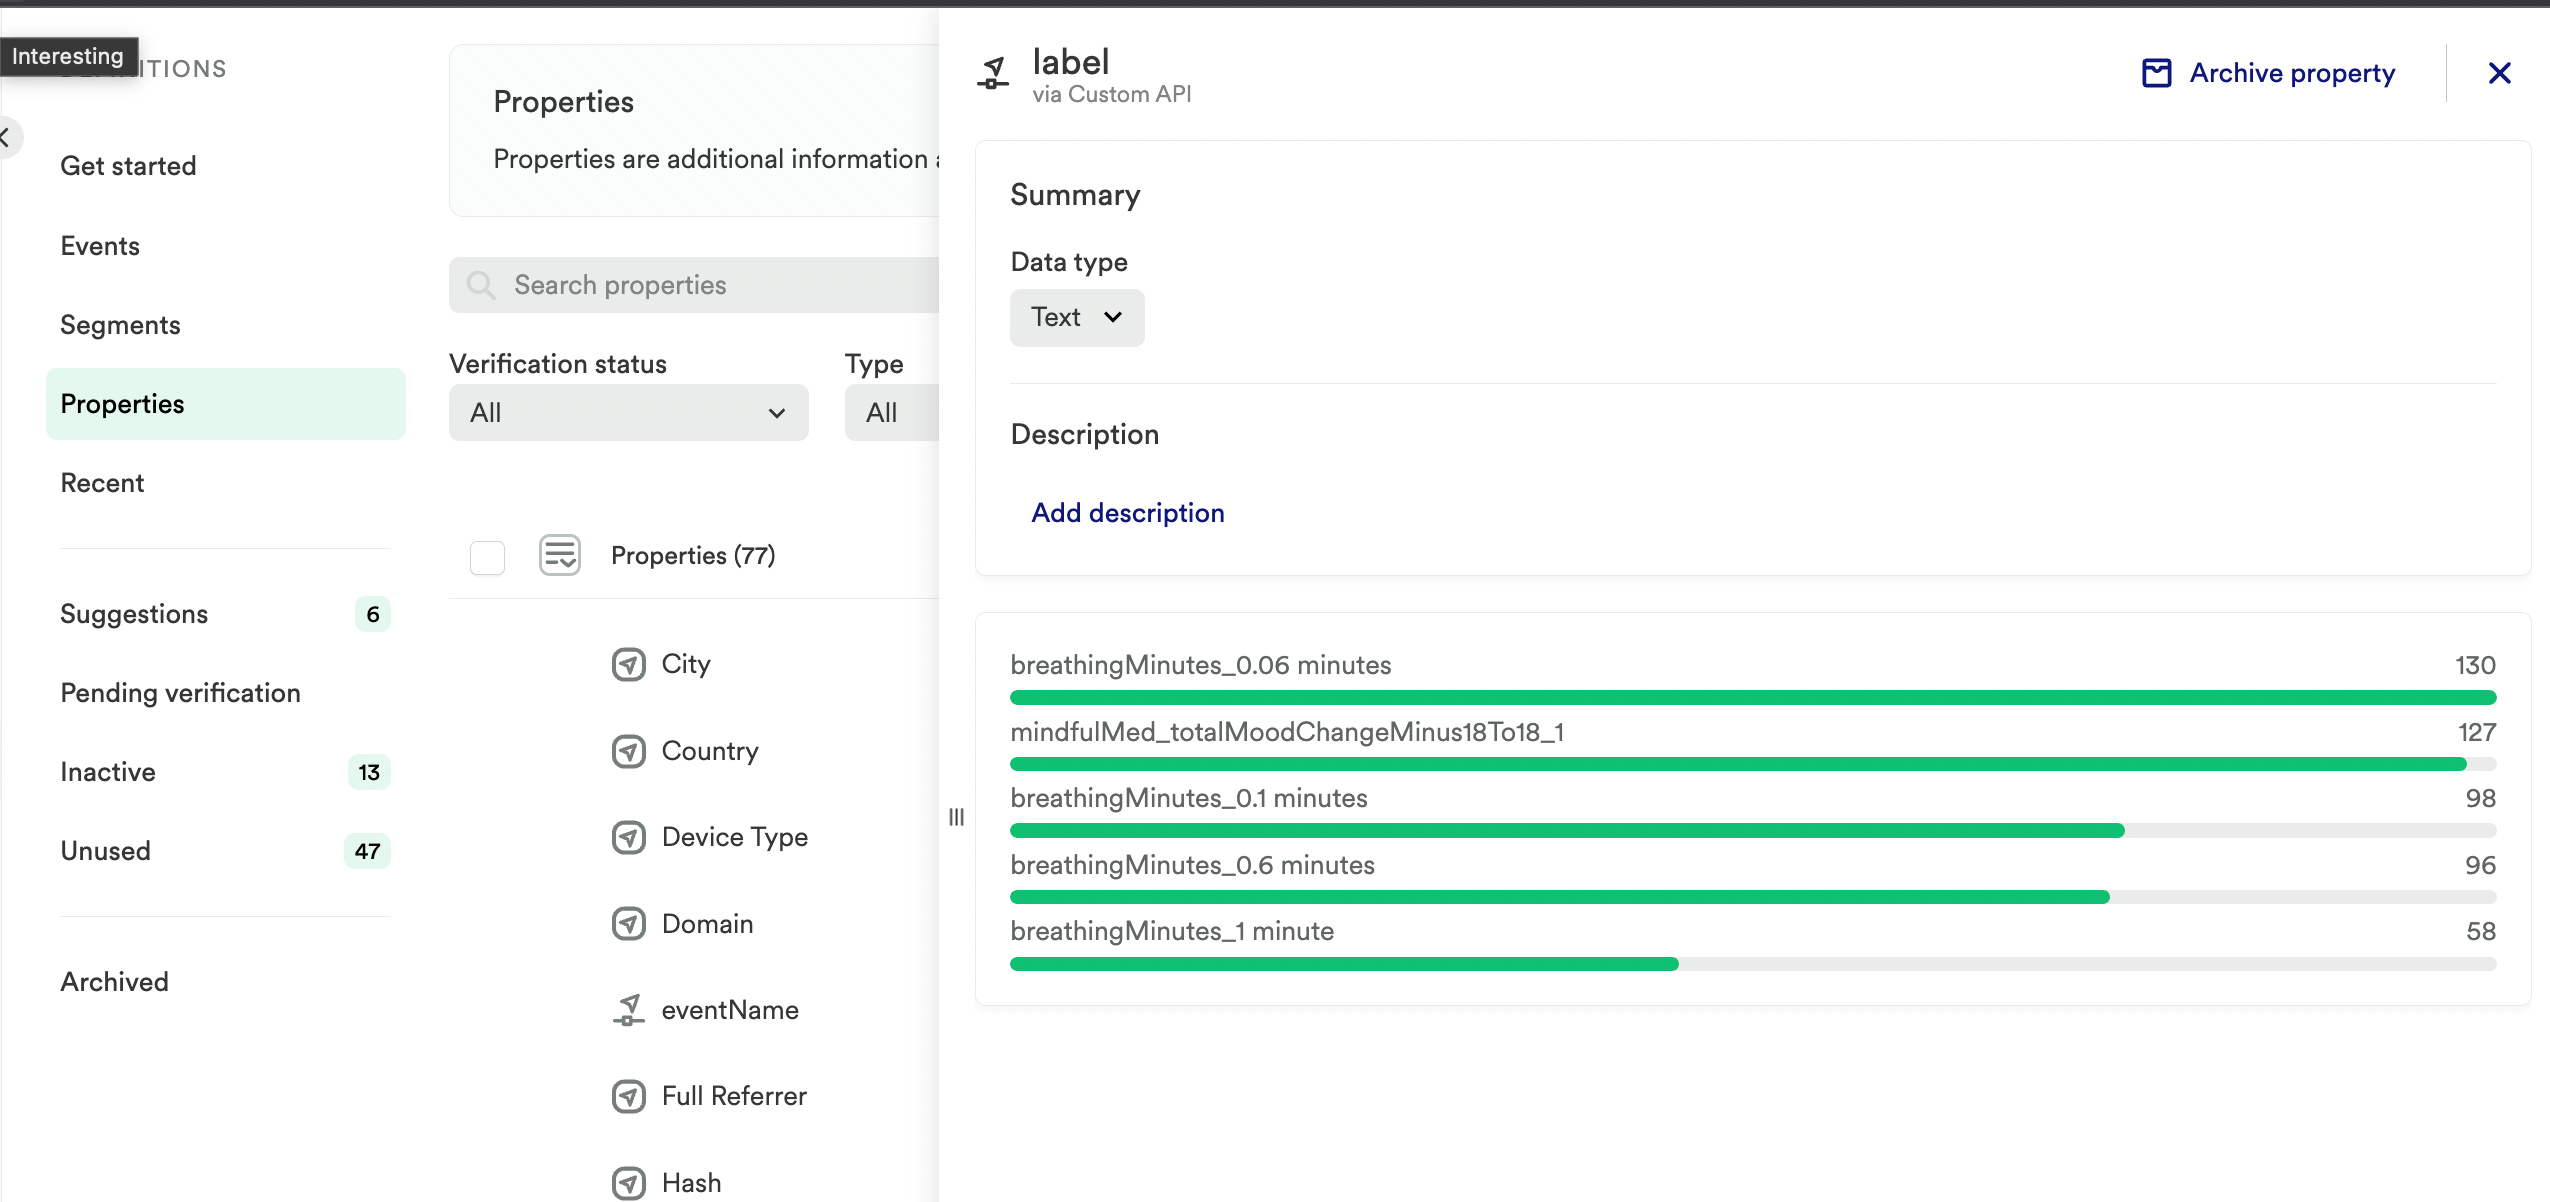
We’ve added a number of custom events. We can see they are being recorded when checking the Properties view.

However, when trying to create a report to filter for Sessions where an event containing “MoodChange” has happened in the last 30 days the count shows zero. 

See here:

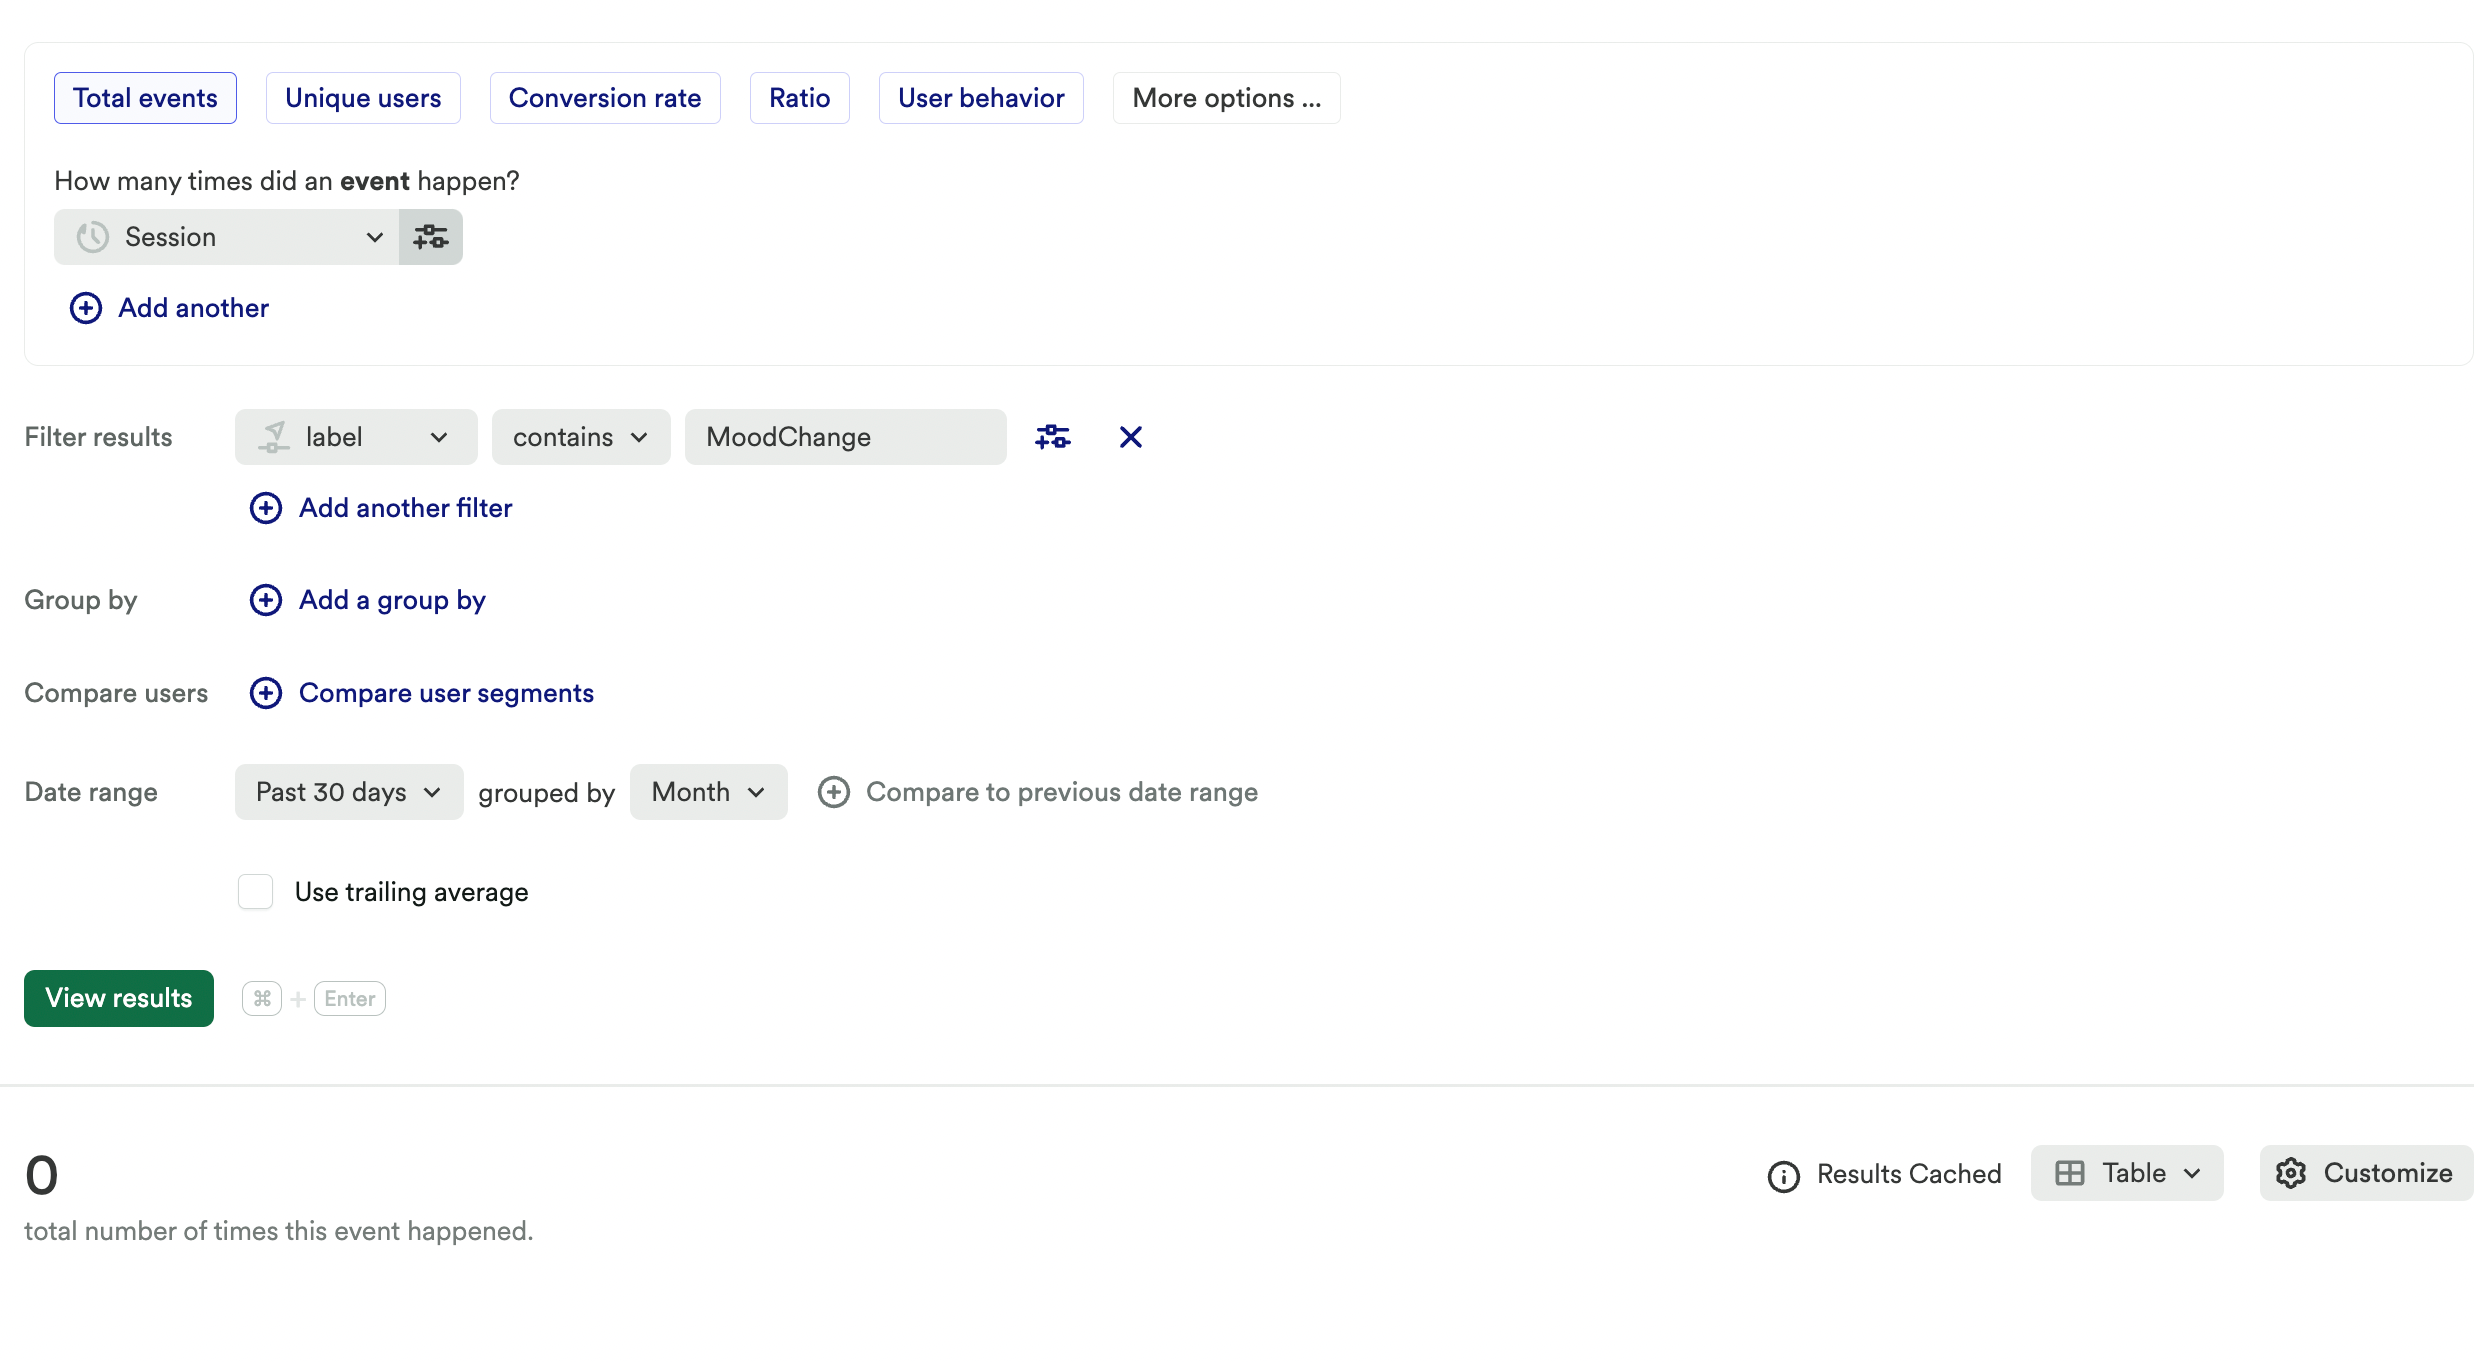
(The same happens if the operator is wildcard contains)

QUESTiON: How can we make this count work?

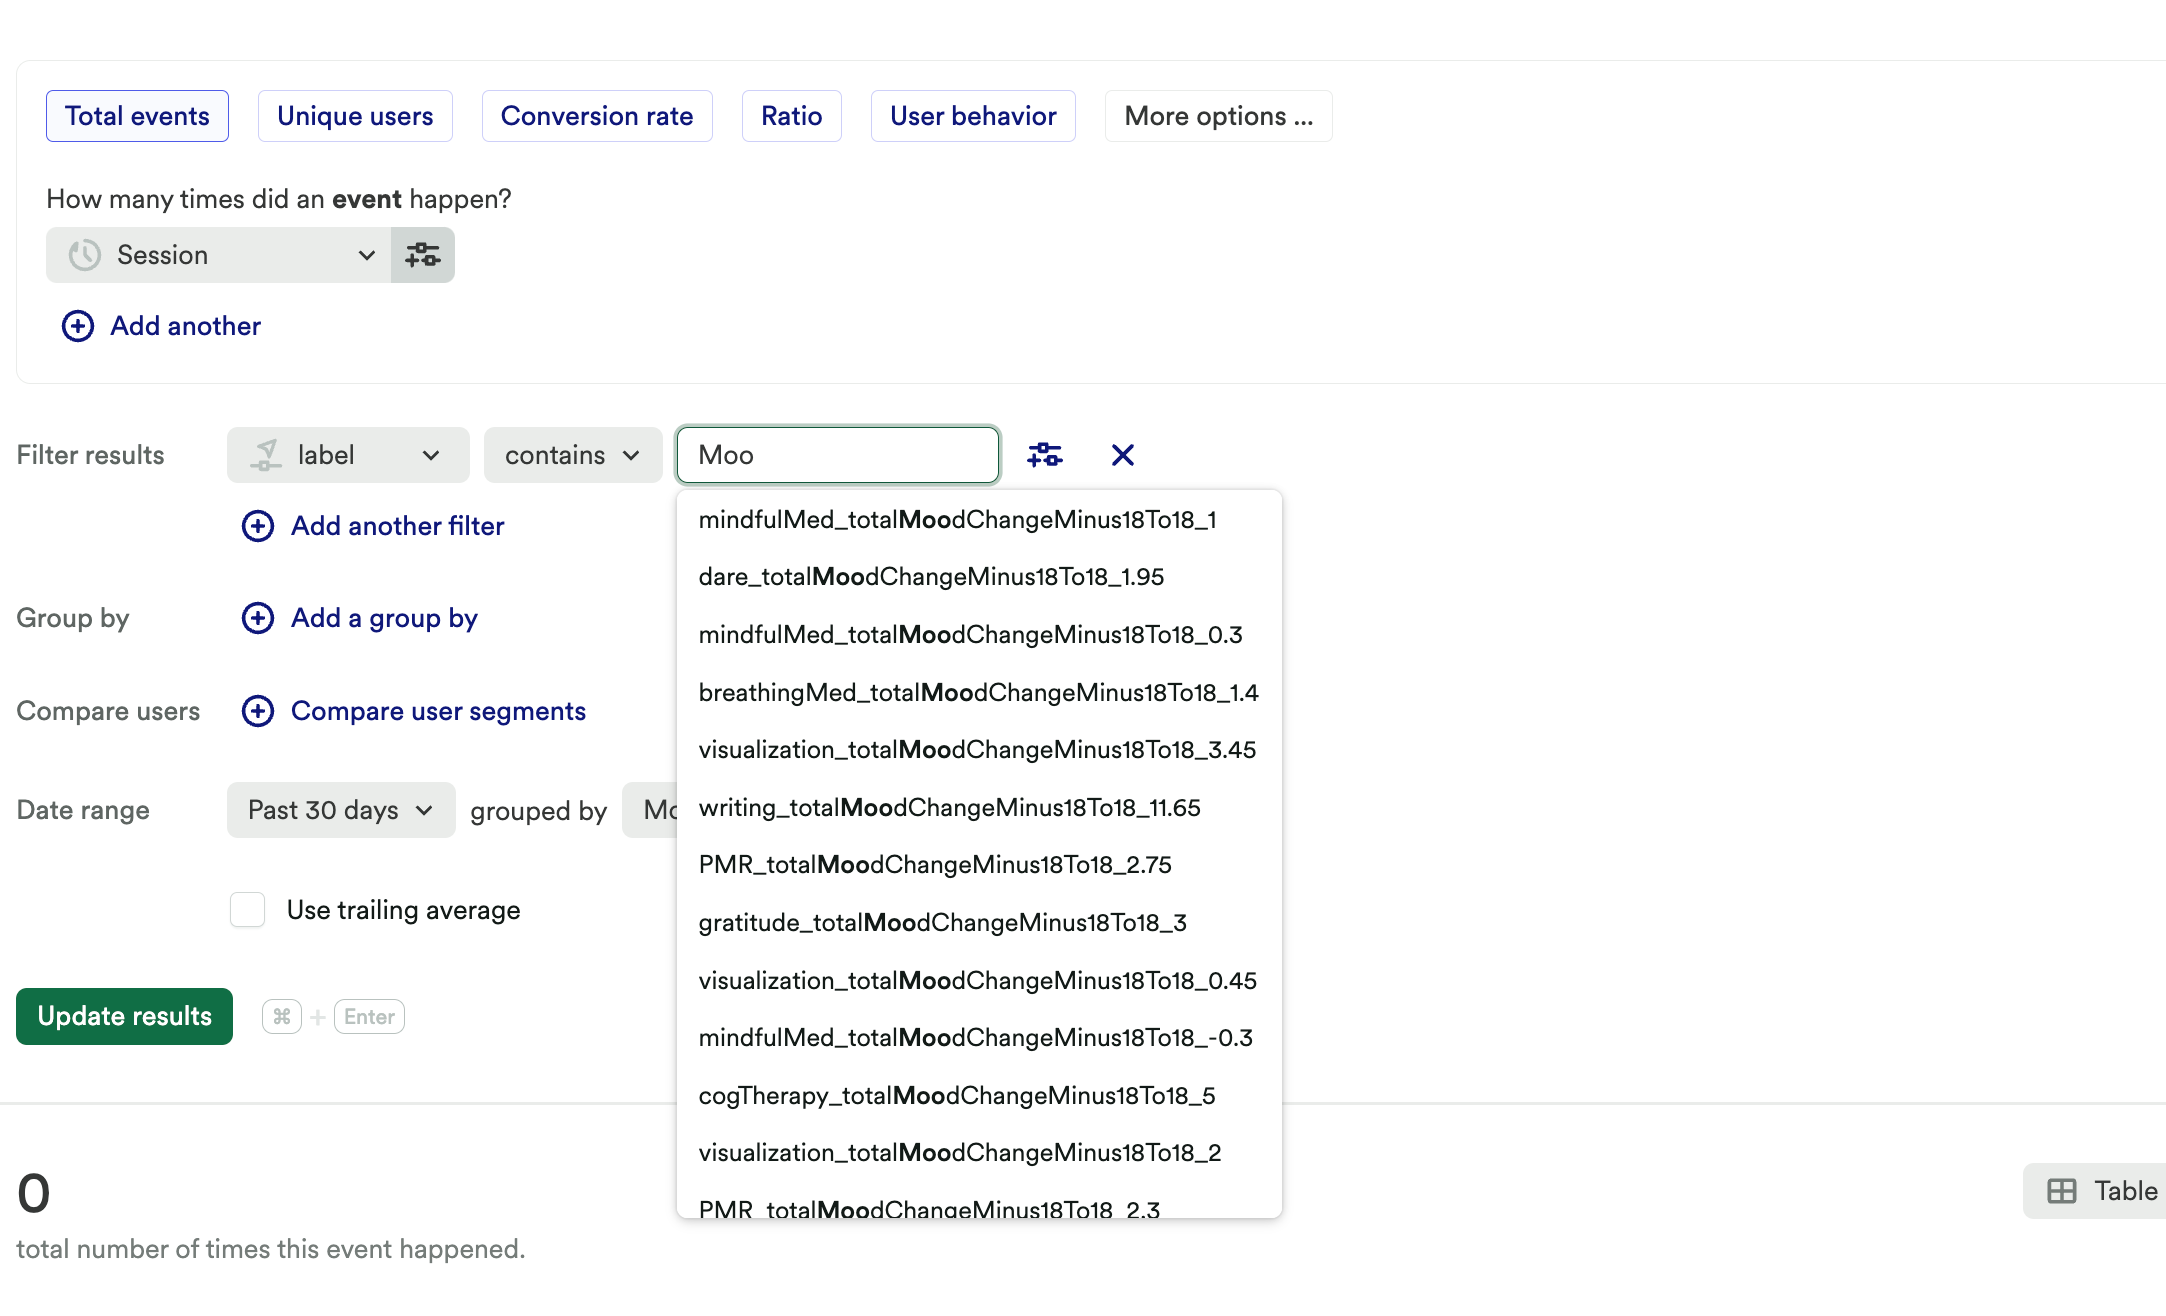
In addition, below in the dropdown, we can see there are many events with a label that contains the string MoodChange — they only differ by the final number after the underscore. But, in the view in Properties (1st screenshot above) we can only see one type of event, the one that ends with “_1”.

QUESTiON: Why is that?

We’d ideally have the label be e.g. mindfulMed_totalMoodChanceMinus8to18_ 

and the value that’s captured be the number that follows after the final underscore.

QUESTION: Is this possible, if so how? (Feel free to just link to the relevant parts of the doc, cos maybe we missed sth in the setup.)

Thanks in advance!

icon

Best answer by Jonas-Heap 2 June 2023, 17:20

View original

2 replies

Userlevel 1
Badge +1

Update on this from the author. 2/3 resolved but +1 new question.
 

✅QUESTiON: How can we make this count work? 

I figured out how to make it work, which was in retrospect obvious, the label was attached to a specific event not to a session.

However, what’s not clear to me is still, why the view in Properties only lists a few event labels not the dozens that exist and show up in the drop down in the chart filters. 

✅ QUESTION: Is this possible, if so how? Separating the number at the end of the label from the label this is also done, the number we are actually passing in as value so it is being passed to heap separately as a number. 

New Question. If we have a custom event variable value sent to Heap as a number is it possible to create a dashboard that performs operations on these numbers? E.g. sum up all values that are > 0.


Userlevel 3
Badge +2

Hi Marta, I’m glad to see you found an answer to two of your questions. To answer the last one, you can absolutely create a report that performs what we call “property calculations”.

First, you’ll want to create a combo event that covers all events with a property that contains “MoodChange”, so you can measure all of those events easily in a single report. Let’s say we call it “[HS] Any Mood Change”.

Second, you’ll want to create a new chart and look under “More options…” for the “Property Calculations” graph. From there, you can sum the values associated with all events with mood changes:

However, what’s not clear to me is still, why the view in Properties only lists a few event labels not the dozens that exist and show up in the drop down in the chart filters. 

The properties listed for any custom or defined event in the Definitions > Properties view show only the most common few values. To view other values, you’ll always want to create a report grouped by that property, which will show you the full range of values.

I hope that helps!

Reply