
Hi all,
Hoping for a little help with an issue that we’re facing. There are a handful of new charts that I created a few months back and they’ve been added to a dashboard. They were working fine previously but something seems to have broken now.
On the dashboard, we’re getting the following for several charts:
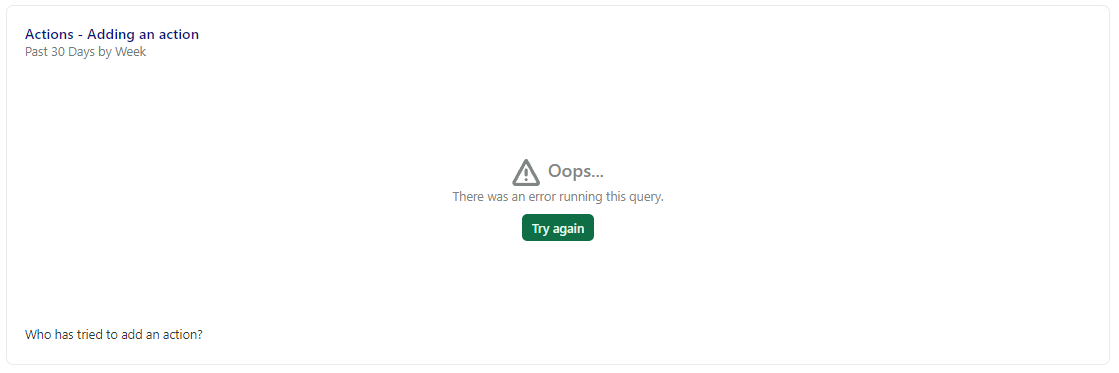
When I click through to see the query in “Analyze”, there is data and a graph is displaying. I can change the filters and date period and everything seems to be working correctly. However, when I return to the Dashboard it says that there is an error. I’ve tried removing it from the dashboard, creating another chart with the same query and it is still erroring on the dashboard.
Strange thing is that I have other charts that are working fine. I’ve checked my definitions for these charts and they seem to be fine. I can see them when I look at user sessions.
Have I missed a trick here?
Really appreciate any help!
Best answer by danielle
View original


