


Currently there are 2 reports type for conversion:
- Conversion over time
- Conversion funnel
To me, both of these are essentially the same report, the main difference being what time expanse you are looking at the data.
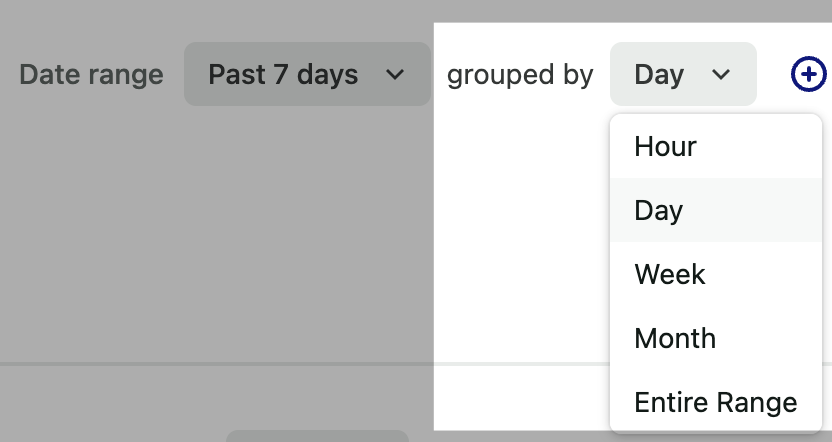
In the case of “conversion rate over time”, you are limited to looking at conversion rate between 2 events but it’s powerful because you can see a trend over time. Your date controls are what you see in other reports types:
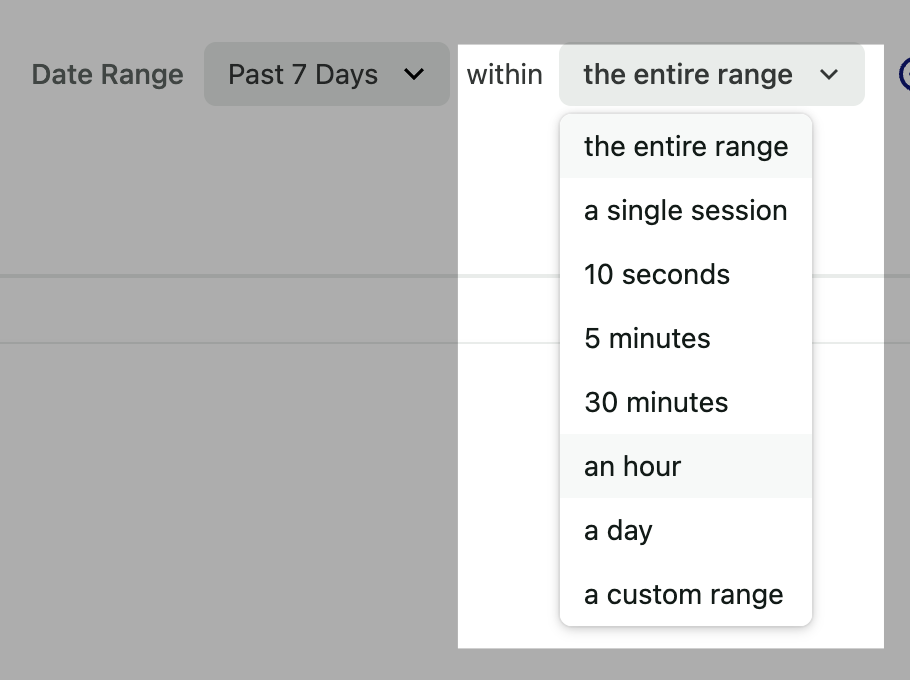
In the case of “conversion funnel”, you can have any amount of steps but are limited to looking at the entire date range as an aggregate report. Your date options are now different and you are implicitly only allowed to look at the entire range but changing the difference in time between the 2 events that qualify as a conversion:
Commonly when I’m looking at a conversion funnel report, I want to know if it’s changing over time. So the only way I can do this is either to:
- Keep changing the date range to see if I can see a pattern (wildly inefficient and error prone)
- Open a new tab and create a “conversion rate over time” report (inefficient and often impossible because you are limited to 2 events)
So the feature request here is to combine these conversion reports into a single report type and just provide both sets of date choices.