Noob here. I just got access to our Heap account into which we are pushing data from multiple web properties (my lingo is probably GA-centric since I know that tool better). I built an implementation by hand to send events with the Custom API from our monolithic web app.
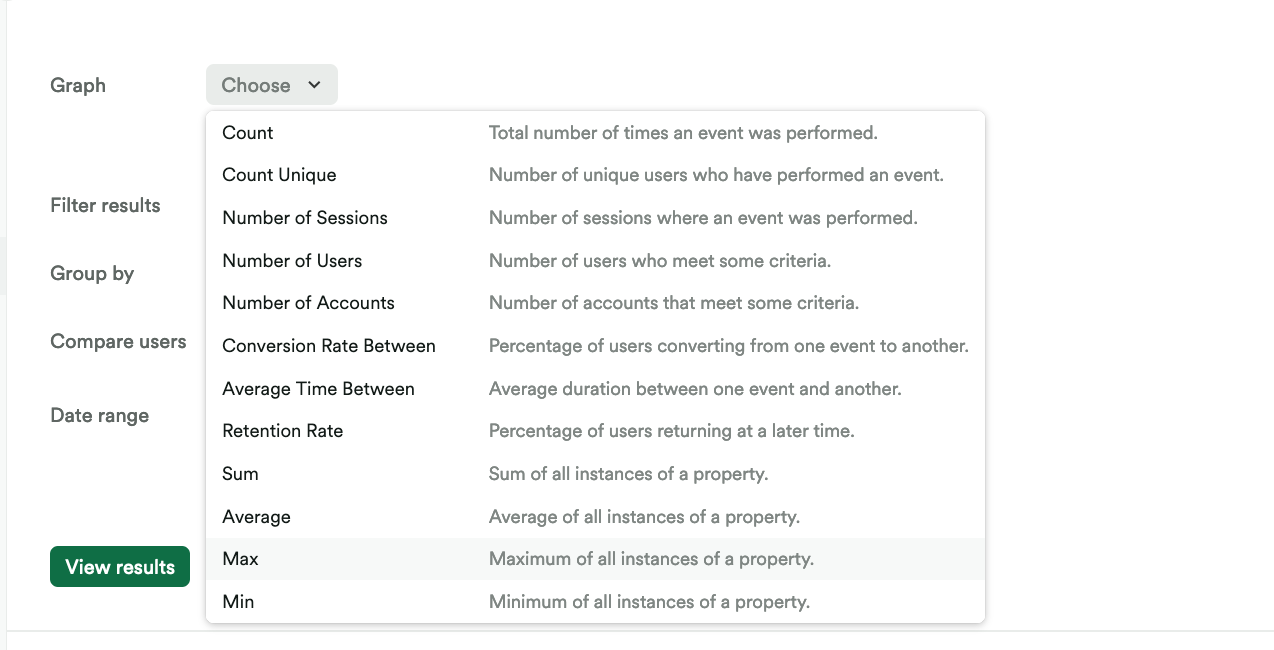
So far I’ve been able to use filters to find events in the live stream and pinpoint various users, and I can see the custom event meta fields I’m sending - but I can’t figure out how to build a chart to view all the users who have a given property.
For example, our app uses a role-based permission system, and I’m sending the user’s role in the custom event. How do I make a chart that breaks down count of users grouped by role?
Best answer by Rohin-Heap
View original