
I would like to make a cumulative bar chart graph, anyone know how to do this? For context, I want to show cumulative finished applications instead of just weekly applications. Thank you!
Best answer by Christy H
View original
I would like to make a cumulative bar chart graph, anyone know how to do this? For context, I want to show cumulative finished applications instead of just weekly applications. Thank you!
Best answer by Christy H
View original
 +3
+3
Hi
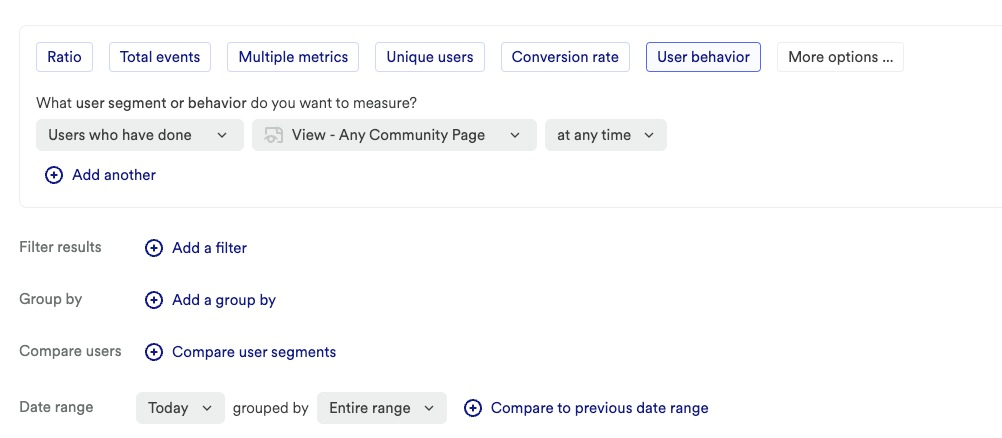
Note: Your UI might look a little bit different as we are testing out a redesign but the dropdown itself should exist in both versions.
Enter your username or e-mail address. We'll send you an e-mail with instructions to reset your password.
