Solved

Retention analysis grouped by date of start event shows duplicate weeks

  • 13 January 2023
  • 7 replies
  • 104 views

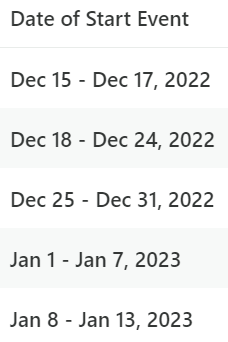
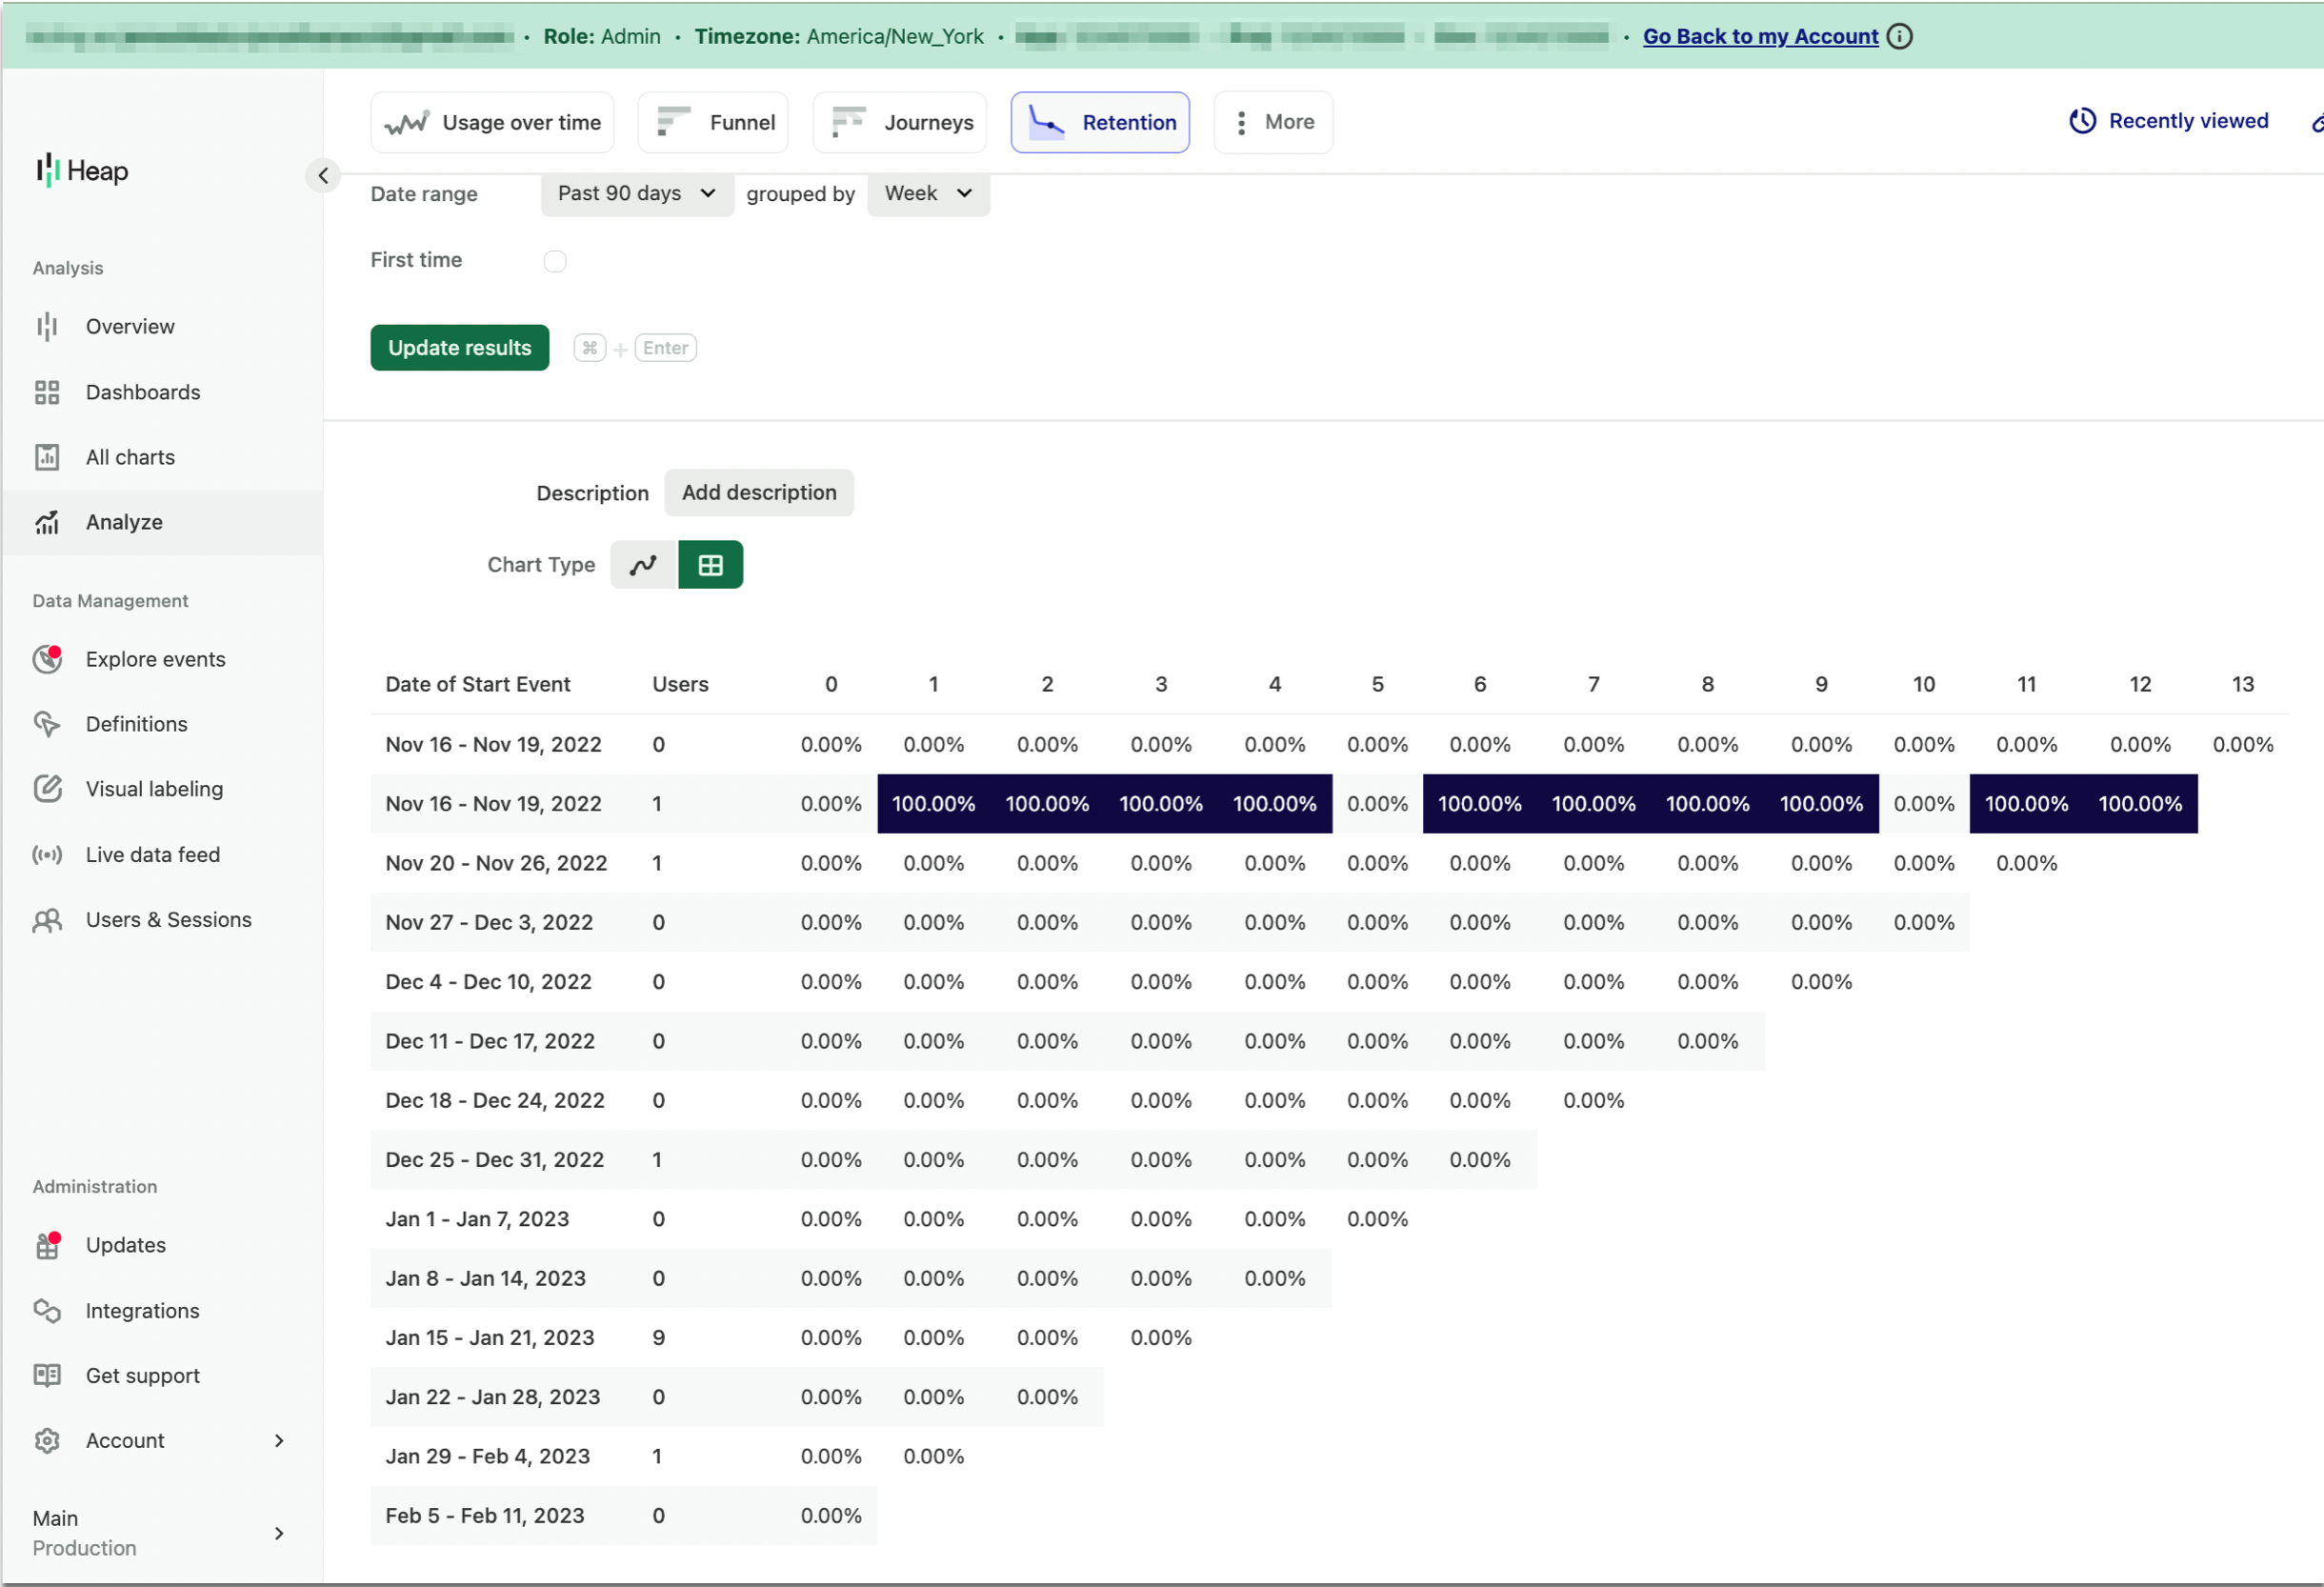
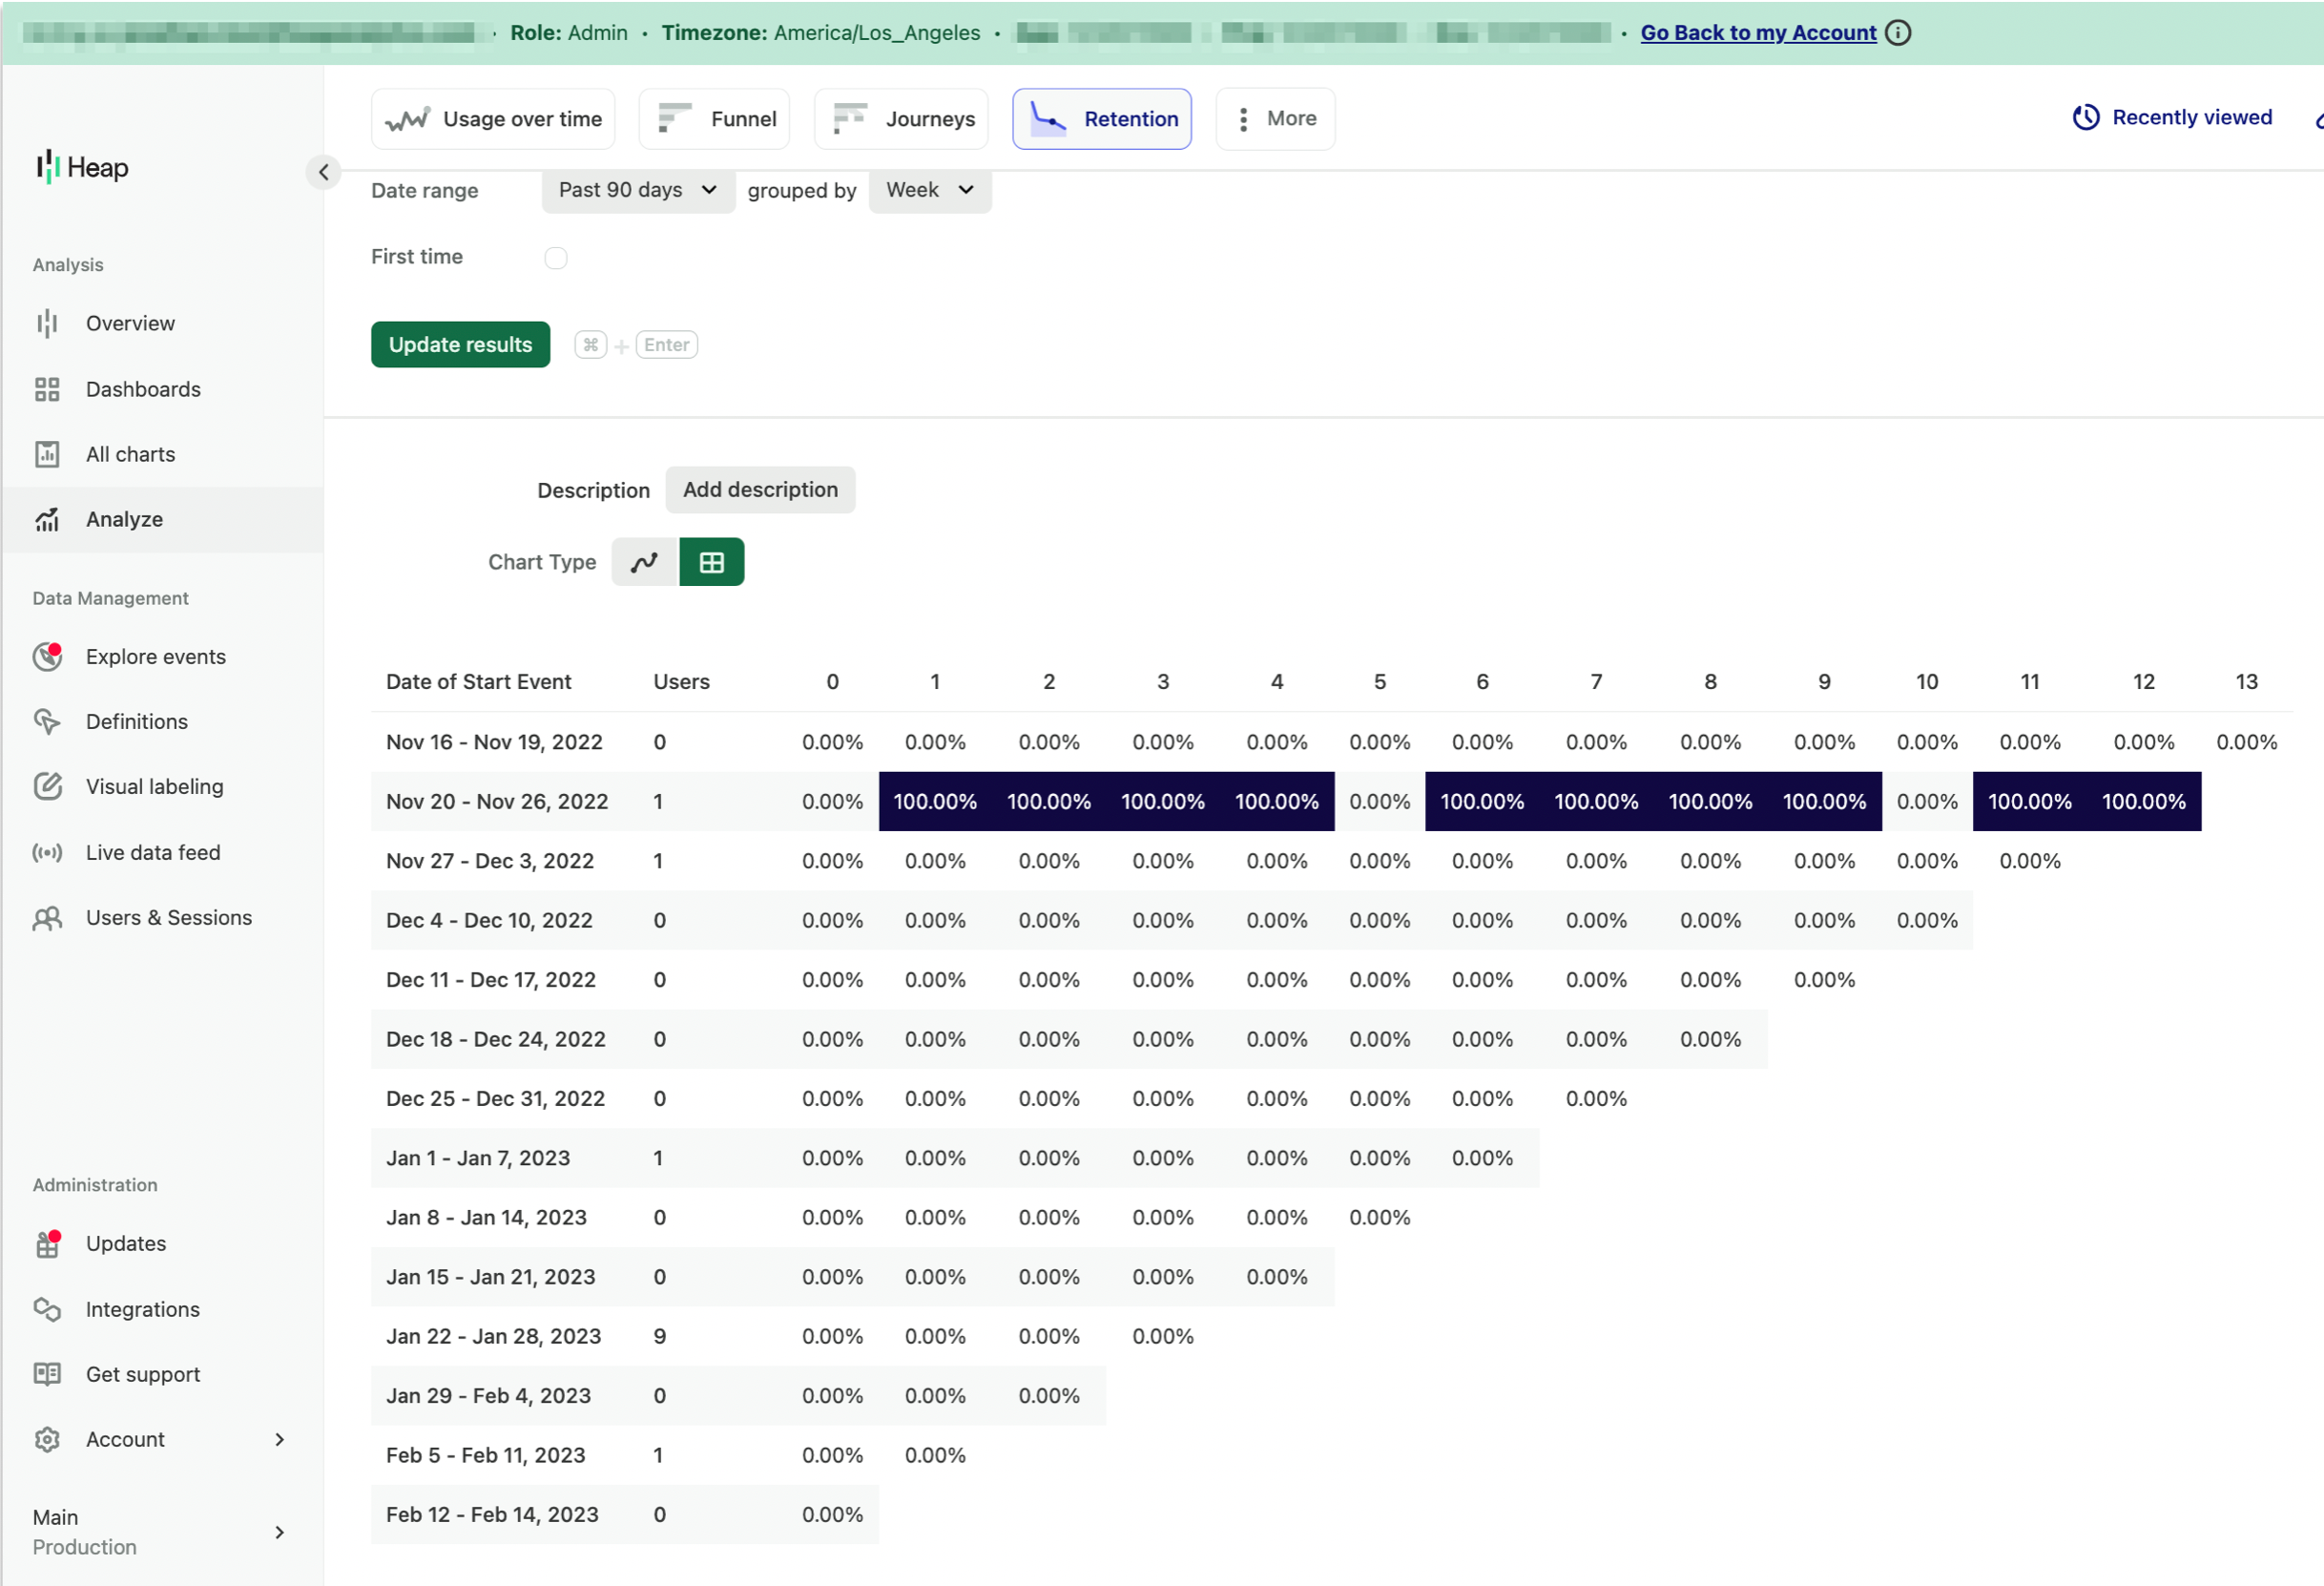
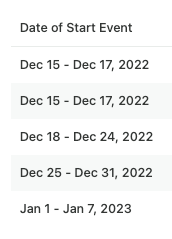
I am creating a retention analysis chart, grouped by the week of the start event and then also grouped by week over the past 30 days. Why are there two first weeks (ie Dec 15 - 17, 2022)? Noting that both of these “weeks” have different user counts. 


icon

Best answer by anthony 13 January 2023, 21:11

View original

7 replies

Userlevel 2
Badge

Hi @laura !  I haven’t seen that before and can’t think of a good reason for that time period to be there twice.  I’m assuming it’s a bug/glitch.  Are you still seeing that type of thing?  If so, I’d encourage you to report it to your Heap rep.  

Userlevel 2
Badge

I just ran a similar report and I don’t see the same week duplicated.  FYI.  


Userlevel 2

Hi Laura, thanks for reporting this—this is definitely a bug! We are working on some helpful improvements to retention charts (including a fix for this) that will be released later this year.

Cheers,


Anthony

Thanks @anthony. How should I interpret the data in the mean time? Assume the weeks are combined?


If helpful when looking at solutions, both my start and repeat actions are combo events. 

Userlevel 5
Badge +3

Hey @laura The bug Anthony refers to is almost certainly a conflict in timezones, which is something you can mitigate while it gets fixed. There can be several timezones in play. 

  1. The timezone of your computer.
  2. The timezone of your Heap account.
  3. The timezone of the Heap account of the user who created the report.

Tl;dr: Make sure your account timezone, the timezone of the user who created the report, and your machine timezone are aligned! 


Here’s an example which might be what you were seeing. I’m logged into my test account as my colleague, who is in New York. I’m in San Francisco and my machine is set to America/Los_Angeles (PST). The week at the top of the retention chat is bugged.


Now I’m logged in as me, same chart, and you can see the chart is not bugged. The above issue emerges because I’m 3 hours behind, which trips up the visualization.


The underlying cause is basically offsets applied on read with flexible timezones against data stored in UTC. Hope this helps!

Userlevel 3
Badge +1

Hi @laura - Just wanted to close the loop here. Our Engineering team recently released a fix for this behavior. Will you let us know if you are still seeing the duplicated rows on your end? Thanks!

Thanks @danielle. I am not seeing the duplicated rows on my end anymore. 

Reply