Hi everyone,
I wanted to know if it's possible to measure the time spend in a given platform page with Heap. Did anyone set up an event like this before?
Thank you!
Bernardo
Best answer by jonathan
View original
Hi everyone,
I wanted to know if it's possible to measure the time spend in a given platform page with Heap. Did anyone set up an event like this before?
Thank you!
Bernardo
Best answer by jonathan
View original +2
+2
Hi Bernardo,
I’m hoping someone else has a clever solution but in general I’ve found most analytics tools can’t do this because in order to capture 100% of users it requires an event to be fired when someone closes their tab or browser, which isn’t possible or at least not easy.
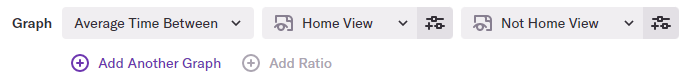
The closest you can do in Heap is measure the difference in time between two tangible events - IE events you have defined in your environment. You could potentially set up an event for a view on a specific page, and then a separate event for a view on every other page excluding the page in your first event. Something like this:
Personally, I’ve never found any practical application of a time-on-page metric. We’ve always found it too complicated to objectively say that a shorter or longer session time is a “good thing”. Some people will swear that if the user gets through a page quickly it means they understood what was going on and were ready to convert. Others will swear that more time on a page is a good thing because it means they’re reading and digesting your content.
Hi Adam,
Thank you for your answer. However, I would like also to know if we are able to get the page load time in Heap? I guess this is also an interesting insight.
Best regards,
Bernardo Madeira

 +3
+3
Hi Jonathan,
Thank you for your prompt reply :). Unfortunately I'm not being able to capture the load time through the Javascript tag. I'm getting No results found when running a report analysis.
I added exactly the same tag you shared.
+2
JavaScript snapshots (and all snapshots, actually) aren’t retroactive, they only start capturing from the time you add them. Is it possible that you haven’t had any new page views since adding the snapshot?
I didn't add the snapshot to new page. Only added to existing events defined previously
+3
hey
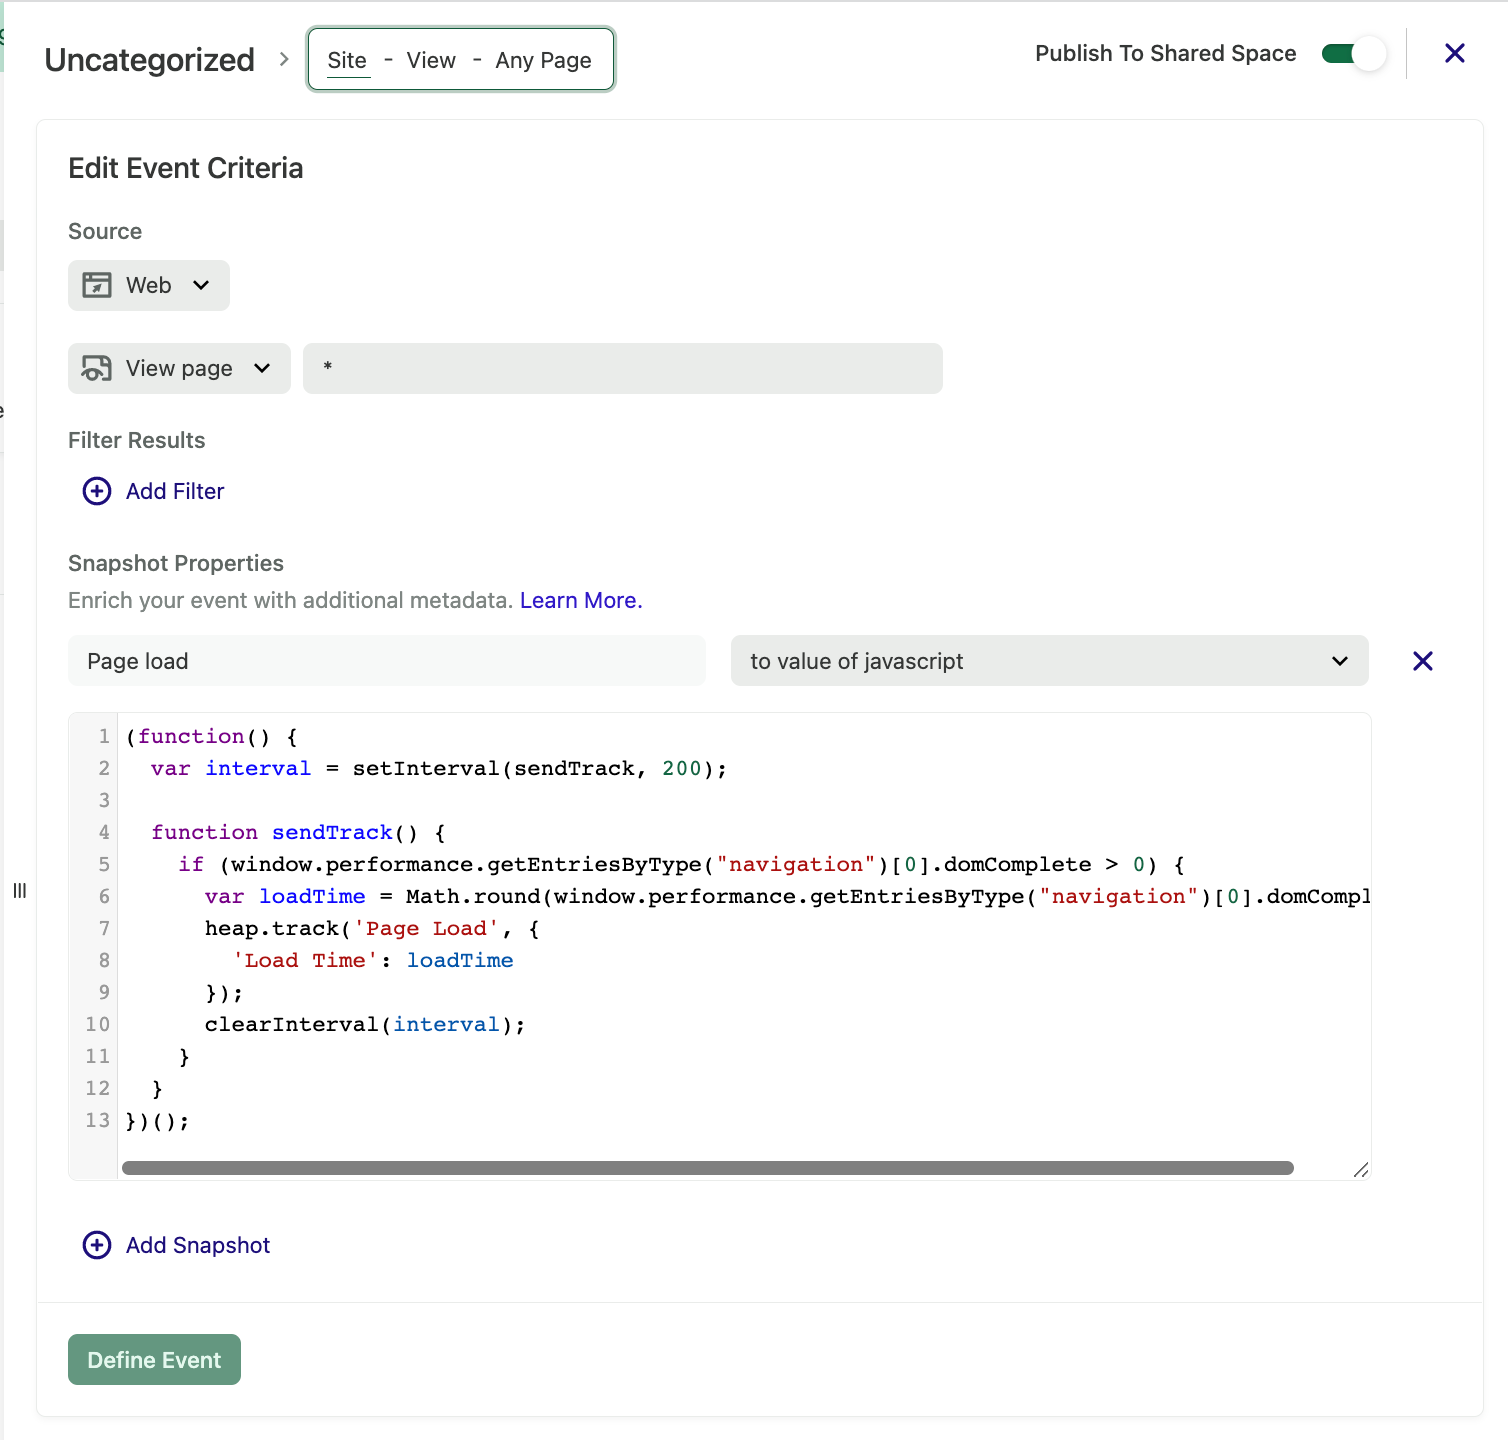
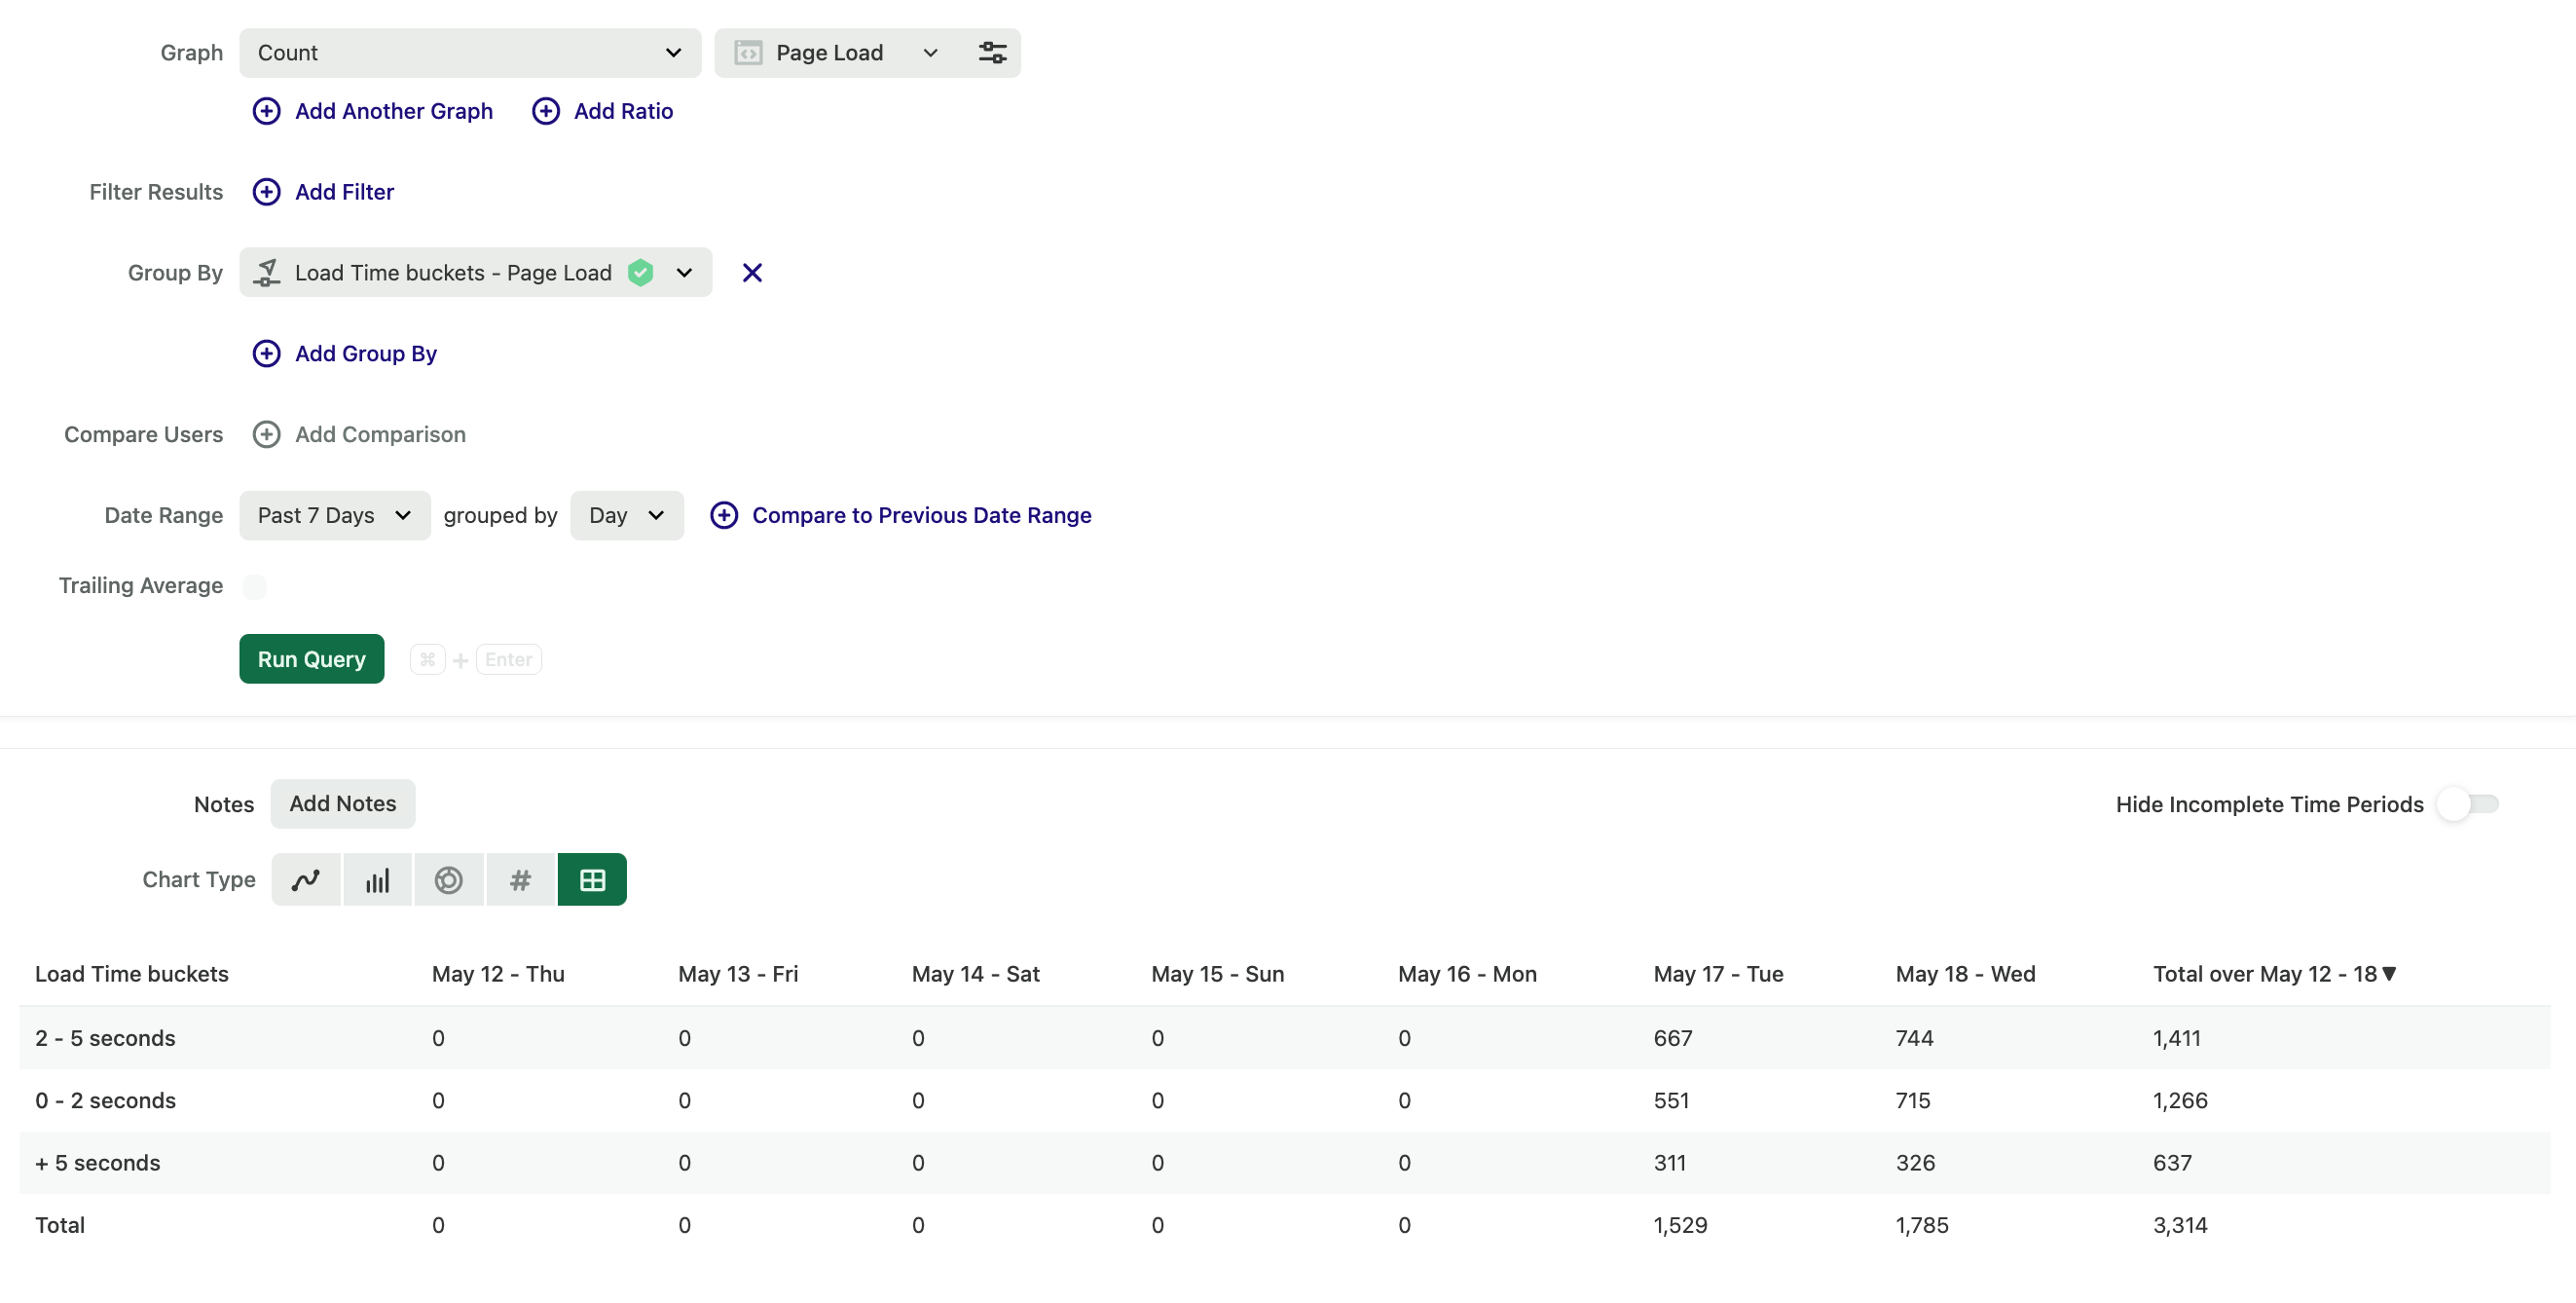
Also remember in this case you’re looking for a custom event, not a property. (Non-SPA Heap pageviews are fired on a browser event called DOMContentLoaded but to get page load time we need to wait until domComplete.) So your report should look like this. You can also group by Path to see load times by page.
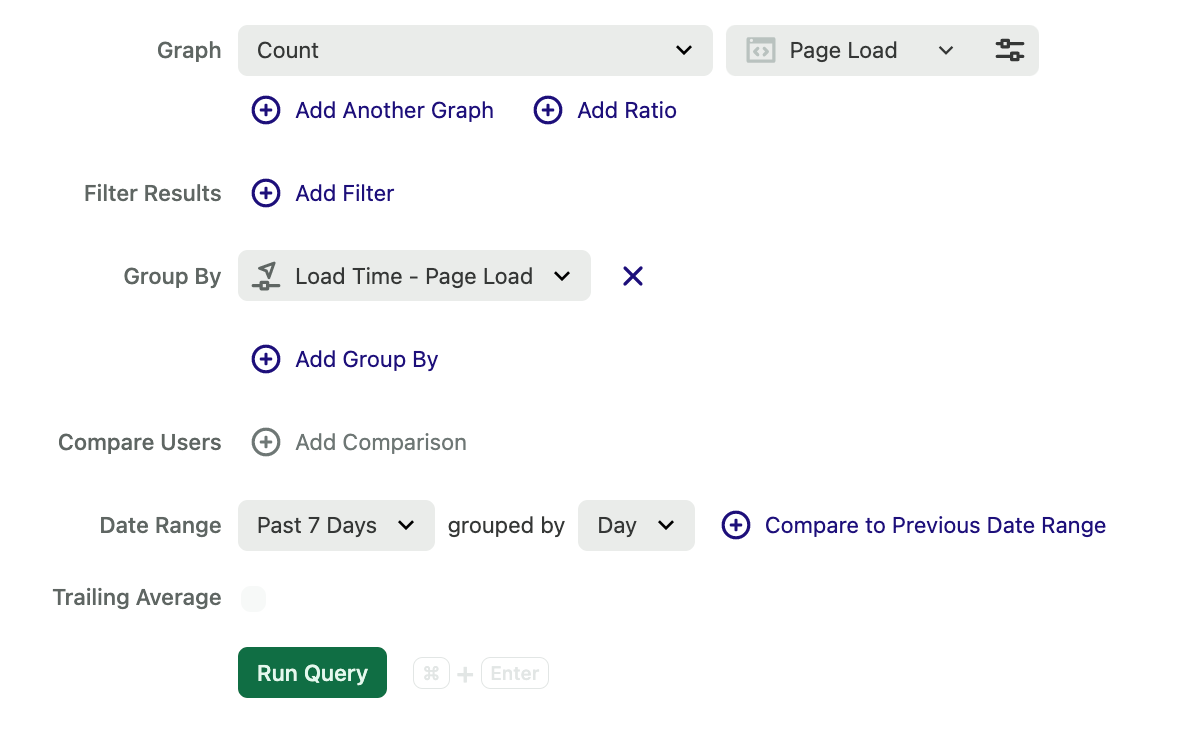
Results are in milliseconds, and by default the report will attempt to bucket them into ranges. You can customize the ranges by creating a Conditional Defined Property For example:
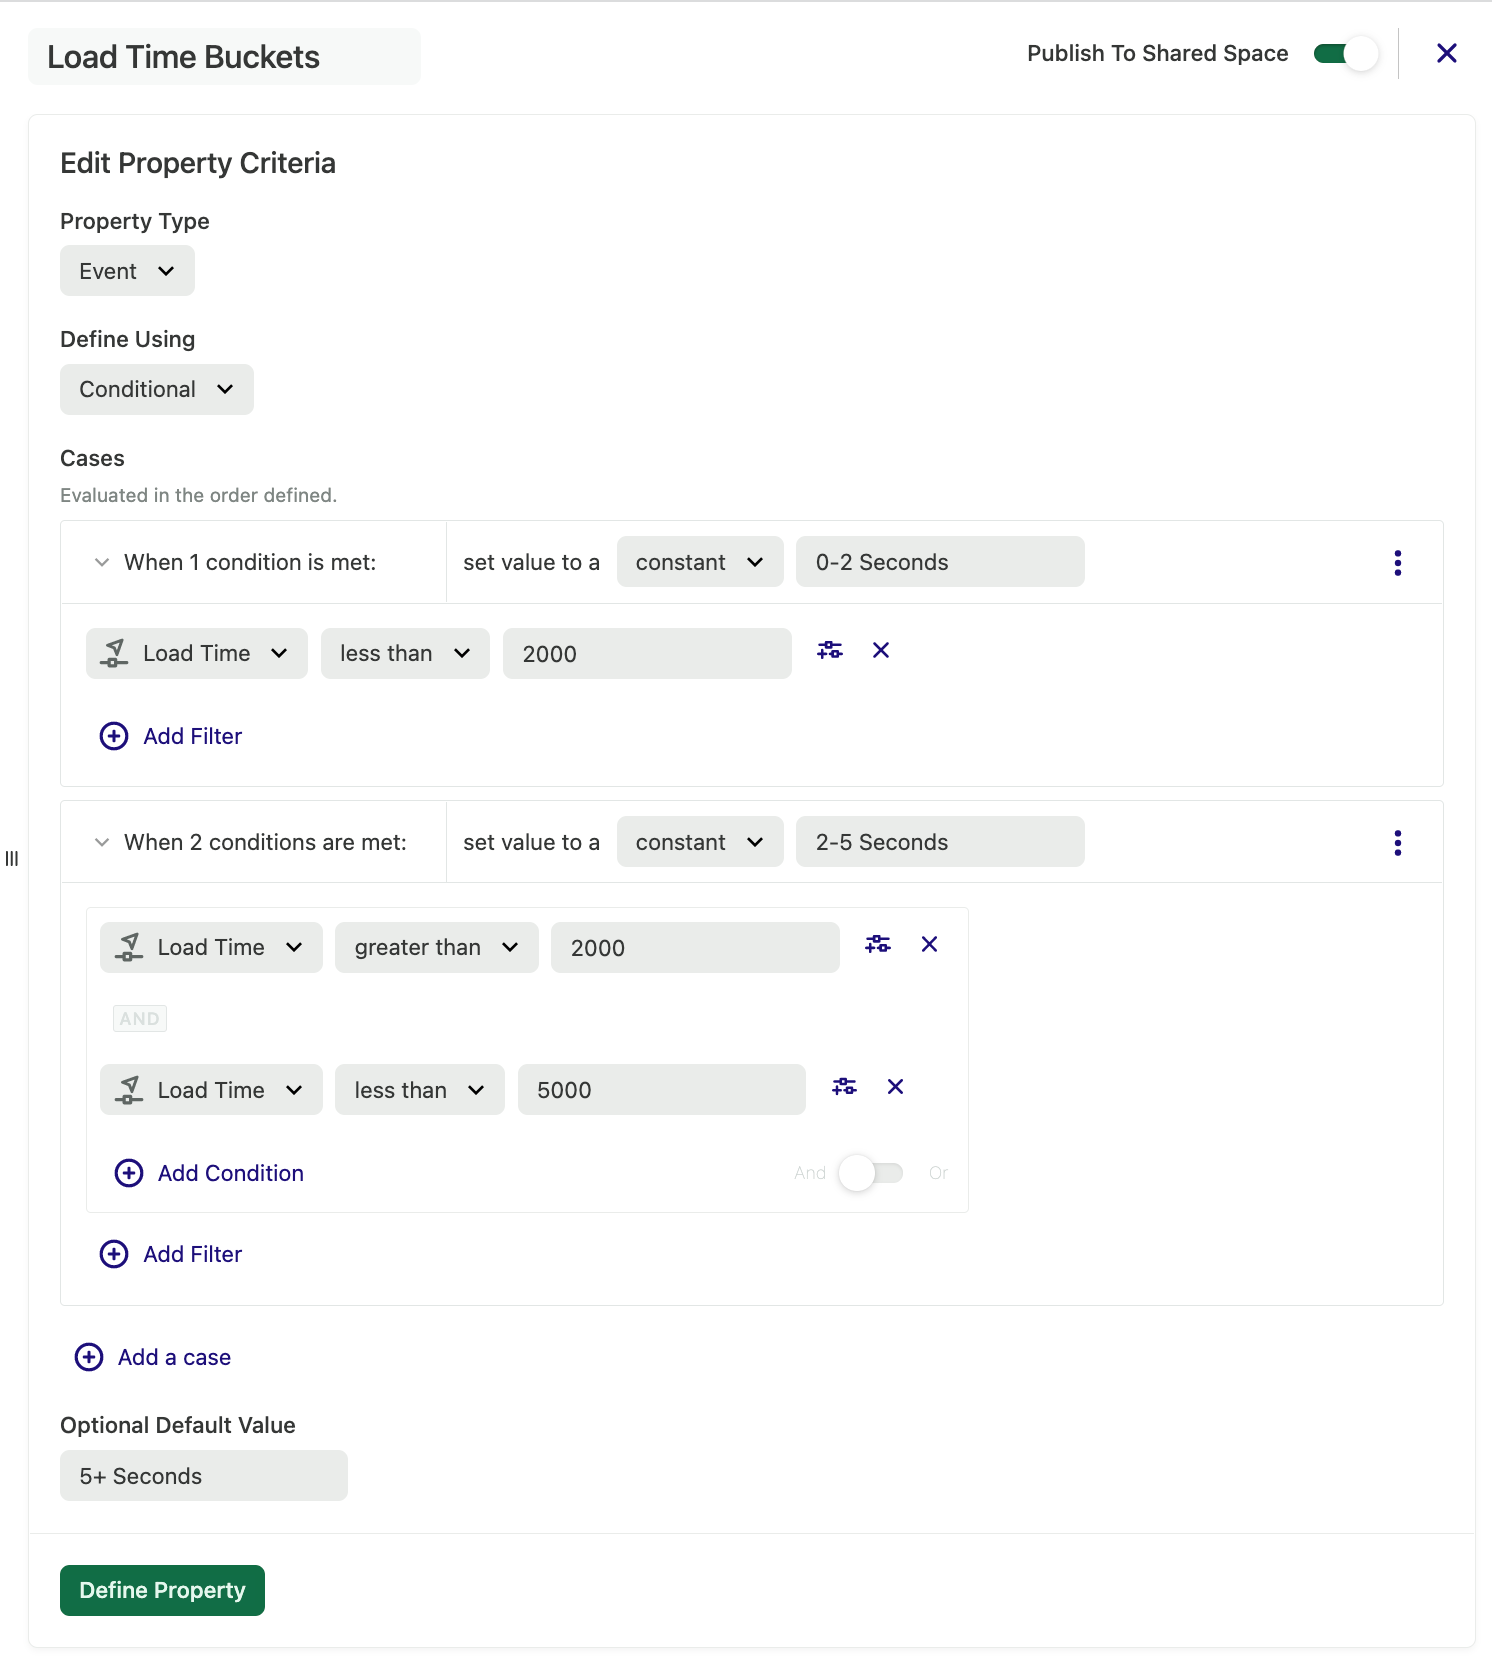
Hope this helps!
Hi Jonathan,
So this means I need to create a new page view event in order to capture the load time? Otherwise I can't get this information?
If I delete the event and create a new one exactly the same as the deleted one, will I be able to capture the load time via JS tag?
Thank you :)
+3
Hey
Let’s summarize where we are for clarity:
/configure-dataflow/dataflow/*Page Load which has a property Load Time. This is necessary because Heap’s pageview fires before all the timing information is available. 
So if you want page load time on all pages in your product:
Does this help clarify things?
Hi Jonathan,
Thanks a lot for your detailed explanation. However, I created a Conditional Defined Property, just like mentioned in previous messages and I can't get the segmentation in my report when I group by the defined property.
+3
It works for me? Are you graphing Page Load or Dataflow - View - Page - Load Time?
Changed the definition! Now it's working for me too :)
+3
Just to clarify for anyone else reading along, I don’t think it was the pageview definition that changed but that you switched the event you were querying. Dataflow - View - Page - Load Time is the event definition (return page views matching /configure-dataflow/dataflow/*) which triggers the custom event Page Load.
Enter your username or e-mail address. We'll send you an e-mail with instructions to reset your password.
