Solved

How do you create a monthly active user view grouped by each month rather than just the last 30 days?

  • 5 January 2024
  • 2 replies
  • 45 views

Hello, 


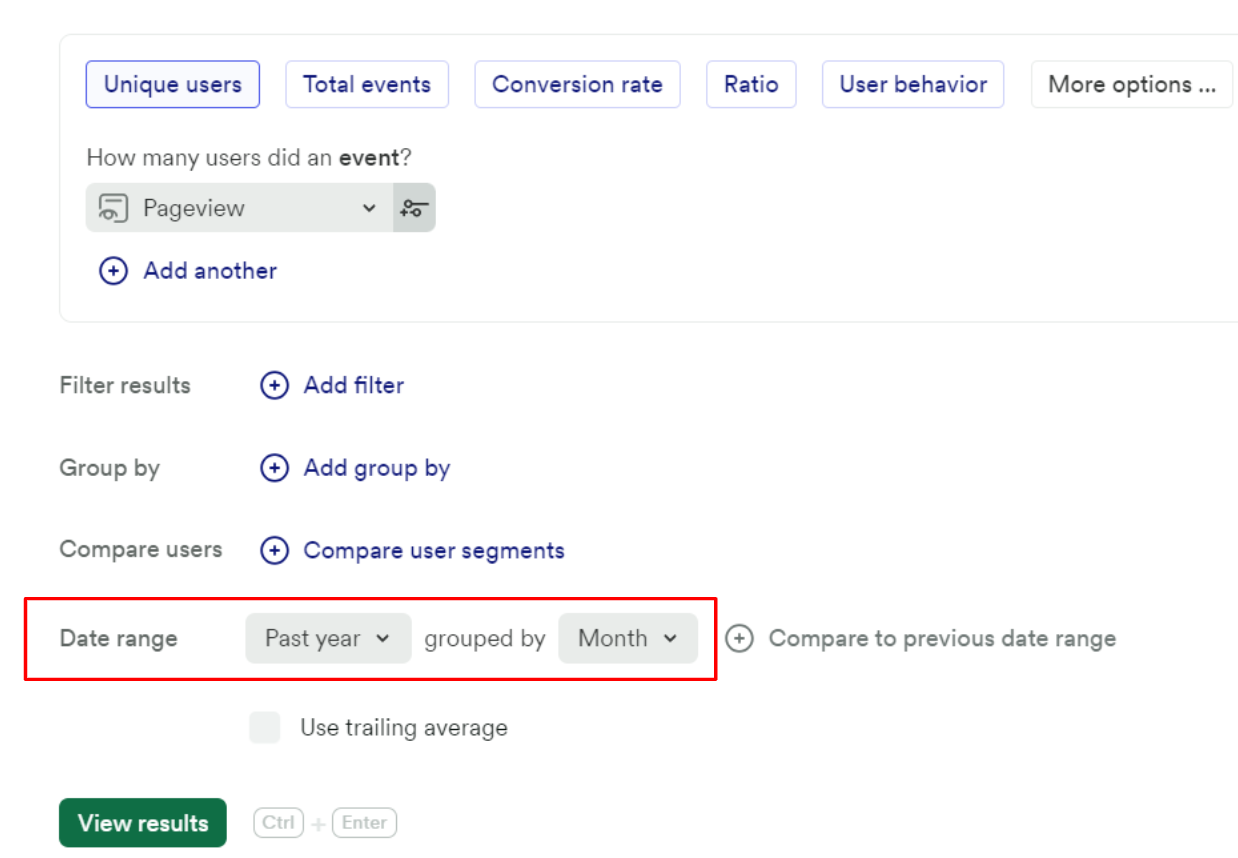
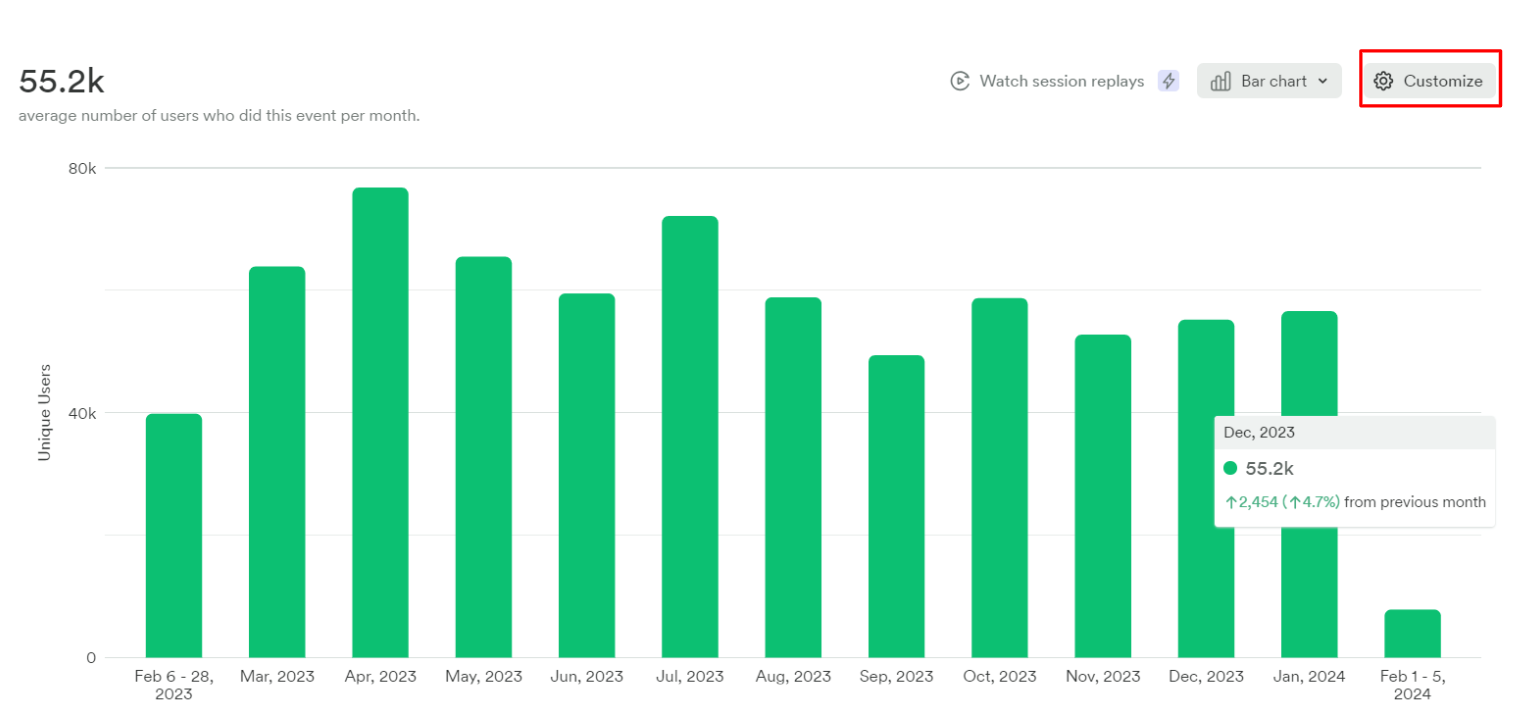
I’m trying to create a monthly active user bar chart, showing how many active users there were in December, how many in January etc. etc.


However, if I use the MAU and then group by month, for our first day in January the number is huge, I think because it’s looking at the last 30 days rather than specifically in the month of January. Does anyone have any suggestions to solve this problem please? 


Thanks


Rachel

icon

Best answer by Shubham Singh 5 February 2024, 17:34

View original

2 replies

Userlevel 1
Badge

Hi @rachelll,

To create a monthly active user bar chart, in the analysis criteria, you need to select the date range as 'past year' and group it by 'month'. This report will present a bar for each month, displaying the monthly active users. I'm sharing a screenshot of the analysis criteria and the result below to illustrate how to set it up and what it looks like:


As the current month is incomplete, the data will be displayed from the 1st day of the month until the current date. You can also hide the incomplete time range in Customize's visibility section by unchecking 'Show incomplete time periods'.


Hope this helps! Please do share whether this solution worked for you or not.

Thank you! Yes this works better that the Heap defined MAU. 

Reply